|
1200
|
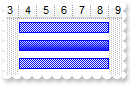
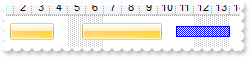
Is it possible to display the task bars with a gradient color
With Exg2antt1
	.BeginUpdate()
	With .Chart
		.FirstVisibleDate = #12/31/2009#
		.LevelCount = 2
		.set_PaneWidth(False,96)
		.Bars.Copy("Task","TaskO")
		With .Bars.Item("Task")
			.Pattern = exontrol.EXG2ANTTLib.PatternEnum.exPatternGradientVBox Or exontrol.EXG2ANTTLib.PatternEnum.exPatternBox Or exontrol.EXG2ANTTLib.PatternEnum.exPatternShadow
			.StartColor = Color.FromArgb(255,255,255)
			.EndColor = .Color
		End With
	End With
	.Columns.Add("Types")
	With .Items
		.AddBar(.AddItem("Original"),"TaskO",#1/4/2010#,#1/9/2010#,"")
		.AddBar(.AddItem("Pattern Gradient"),"Task",#1/4/2010#,#1/9/2010#,"")
		.AddBar(.AddItem("Original"),"TaskO",#1/4/2010#,#1/9/2010#,"")
	End With
	.EndUpdate()
End With
|
|
1199
|
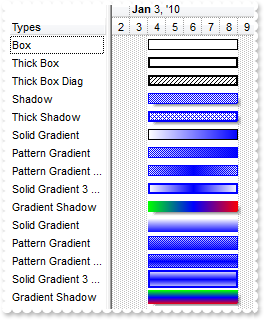
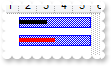
How can I know the type of bars I can displays using predefined patterns
With Exg2antt1
	.BeginUpdate()
	With .Chart
		.FirstVisibleDate = #12/31/2009#
		.LevelCount = 2
		.set_PaneWidth(False,96)
		With .Bars
			.Add("Box").Pattern = exontrol.EXG2ANTTLib.PatternEnum.exPatternBox
			.Add("ThickBox").Pattern = exontrol.EXG2ANTTLib.PatternEnum.exPatternThickBox Or exontrol.EXG2ANTTLib.PatternEnum.exPatternBox
			.Add("DiagBox").Pattern = exontrol.EXG2ANTTLib.PatternEnum.exPatternThickBox Or exontrol.EXG2ANTTLib.PatternEnum.exPatternBDiagonal
			.Copy("Task","Shadow").Pattern = exontrol.EXG2ANTTLib.PatternEnum.exPatternFrameShadow Or exontrol.EXG2ANTTLib.PatternEnum.exPatternShadow
			.Copy("Task","TShadow").Pattern = exontrol.EXG2ANTTLib.PatternEnum.exPatternFrameShadow Or exontrol.EXG2ANTTLib.PatternEnum.exPatternThickBox Or exontrol.EXG2ANTTLib.PatternEnum.exPatternDiagCross
			With .Add("HGrad1")
				.Pattern = exontrol.EXG2ANTTLib.PatternEnum.exPatternBox
				.StartColor = Color.FromArgb(255,255,255)
				.EndColor = Color.FromArgb(0,0,255)
			End With
			With .Add("HGrad2")
				.Pattern = exontrol.EXG2ANTTLib.PatternEnum.exPatternBox Or exontrol.EXG2ANTTLib.PatternEnum.exPatternShadow
				.StartColor = Color.FromArgb(255,255,255)
				.EndColor = Color.FromArgb(0,0,255)
				.Color = Color.FromArgb(0,0,255)
			End With
			With .Add("HGrad3")
				.Pattern = exontrol.EXG2ANTTLib.PatternEnum.exPatternGradient3Colors Or exontrol.EXG2ANTTLib.PatternEnum.exPatternBox Or exontrol.EXG2ANTTLib.PatternEnum.exPatternShadow
				.StartColor = Color.FromArgb(255,255,255)
				.EndColor = .StartColor
				.Color = Color.FromArgb(0,0,255)
			End With
			With .Add("HGrad4")
				.Pattern = exontrol.EXG2ANTTLib.PatternEnum.exPatternThickBox Or exontrol.EXG2ANTTLib.PatternEnum.exPatternGradient3Colors Or exontrol.EXG2ANTTLib.PatternEnum.exPatternBox
				.StartColor = Color.FromArgb(255,255,255)
				.EndColor = .StartColor
				.Color = Color.FromArgb(0,0,255)
			End With
			With .Add("HGrad5")
				.Pattern = exontrol.EXG2ANTTLib.PatternEnum.exPatternFrameShadow Or exontrol.EXG2ANTTLib.PatternEnum.exPatternGradient3Colors Or exontrol.EXG2ANTTLib.PatternEnum.exPatternBox
				.StartColor = Color.FromArgb(0,255,0)
				.EndColor = Color.FromArgb(255,0,0)
				.Color = Color.FromArgb(0,0,255)
			End With
			With .Add("VGrad1")
				.Pattern = exontrol.EXG2ANTTLib.PatternEnum.exPatternGradientVBox Or exontrol.EXG2ANTTLib.PatternEnum.exPatternBox
				.StartColor = Color.FromArgb(255,255,255)
				.EndColor = Color.FromArgb(0,0,255)
				.Height = 14
			End With
			With .Add("VGrad2")
				.Pattern = exontrol.EXG2ANTTLib.PatternEnum.exPatternGradientVBox Or exontrol.EXG2ANTTLib.PatternEnum.exPatternBox Or exontrol.EXG2ANTTLib.PatternEnum.exPatternShadow
				.StartColor = Color.FromArgb(255,255,255)
				.EndColor = Color.FromArgb(0,0,255)
				.Color = Color.FromArgb(0,0,255)
				.Height = 14
			End With
			With .Add("VGrad3")
				.Pattern = exontrol.EXG2ANTTLib.PatternEnum.exPatternGradient3Colors Or exontrol.EXG2ANTTLib.PatternEnum.exPatternGradientVBox Or exontrol.EXG2ANTTLib.PatternEnum.exPatternBox Or exontrol.EXG2ANTTLib.PatternEnum.exPatternShadow
				.StartColor = Color.FromArgb(255,255,255)
				.EndColor = .StartColor
				.Color = Color.FromArgb(0,0,255)
				.Height = 14
			End With
			With .Add("VGrad4")
				.Pattern = exontrol.EXG2ANTTLib.PatternEnum.exPatternThickBox Or exontrol.EXG2ANTTLib.PatternEnum.exPatternGradient3Colors Or exontrol.EXG2ANTTLib.PatternEnum.exPatternGradientVBox Or exontrol.EXG2ANTTLib.PatternEnum.exPatternBox
				.StartColor = Color.FromArgb(255,255,255)
				.EndColor = .StartColor
				.Color = Color.FromArgb(0,0,255)
				.Height = -1
			End With
			With .Add("VGrad5")
				.Pattern = exontrol.EXG2ANTTLib.PatternEnum.exPatternFrameShadow Or exontrol.EXG2ANTTLib.PatternEnum.exPatternGradient3Colors Or exontrol.EXG2ANTTLib.PatternEnum.exPatternGradientVBox Or exontrol.EXG2ANTTLib.PatternEnum.exPatternBox
				.StartColor = Color.FromArgb(0,255,0)
				.EndColor = Color.FromArgb(255,0,0)
				.Color = Color.FromArgb(0,0,255)
				.Height = 14
			End With
		End With
	End With
	.Columns.Add("Types")
	With .Items
		.AddBar(.AddItem("Box"),"Box",#1/4/2010#,#1/9/2010#,"")
		.AddBar(.AddItem("Thick Box"),"ThickBox",#1/4/2010#,#1/9/2010#,"")
		.AddBar(.AddItem("Thick Box Diag"),"DiagBox",#1/4/2010#,#1/9/2010#,"")
		.AddBar(.AddItem("Shadow"),"Shadow",#1/4/2010#,#1/9/2010#,"")
		.AddBar(.AddItem("Thick Shadow"),"TShadow",#1/4/2010#,#1/9/2010#,"")
		.AddBar(.AddItem("Solid Gradient"),"HGrad1",#1/4/2010#,#1/9/2010#,"")
		.AddBar(.AddItem("Pattern Gradient"),"HGrad2",#1/4/2010#,#1/9/2010#,"")
		.AddBar(.AddItem("Pattern Gradient 3 Colors"),"HGrad3",#1/4/2010#,#1/9/2010#,"")
		.AddBar(.AddItem("Solid Gradient 3 Colors"),"HGrad4",#1/4/2010#,#1/9/2010#,"")
		.AddBar(.AddItem("Gradient Shadow"),"HGrad5",#1/4/2010#,#1/9/2010#,"")
		.AddBar(.AddItem("Solid Gradient"),"VGrad1",#1/4/2010#,#1/9/2010#,"")
		.AddBar(.AddItem("Pattern Gradient"),"VGrad2",#1/4/2010#,#1/9/2010#,"")
		.AddBar(.AddItem("Pattern Gradient 3 Colors"),"VGrad3",#1/4/2010#,#1/9/2010#,"")
		.AddBar(.AddItem("Solid Gradient 3 Colors"),"VGrad4",#1/4/2010#,#1/9/2010#,"")
		.AddBar(.AddItem("Gradient Shadow"),"VGrad5",#1/4/2010#,#1/9/2010#,"")
	End With
	.EndUpdate()
End With
|
|
1198
|
Is it possible to display the bars with a thicker border

With Exg2antt1
	.BeginUpdate()
	.Columns.Add("Task")
	.Chart.FirstVisibleDate = #1/1/2001#
	.Chart.set_PaneWidth(False,48)
	.Chart.Bars.Copy("Task","TaskB").Pattern = exontrol.EXG2ANTTLib.PatternEnum.exPatternThickBox Or exontrol.EXG2ANTTLib.PatternEnum.exPatternShadow
	With .Items
		.AddBar(.AddItem("Task 1"),"Task",#1/2/2001#,#1/5/2001#,"")
		.AddBar(.AddItem("Task 2"),"TaskB",#1/2/2001#,#1/5/2001#,"")
		.AddBar(.AddItem("Task 3"),"Task",#1/2/2001#,#1/5/2001#,"")
	End With
	.EndUpdate()
End With
|
|
1197
|
Is it possible to display the shadow for EBN bars

With Exg2antt1
	.BeginUpdate()
	.VisualAppearance.Add(1,"c:\exontrol\images\normal.ebn")
	.Columns.Add("Task")
	.Chart.FirstVisibleDate = #1/1/2001#
	.Chart.set_PaneWidth(False,48)
	With .Chart.Bars.Copy("Task","EBN")
		.Color32 = &H1000000
		.Pattern = exontrol.EXG2ANTTLib.PatternEnum.exPatternFrameShadow
	End With
	.Chart.Bars.Copy("Task","EBN2").Color32 = &H1000000
	With .Items
		.AddBar(.AddItem("Task 1"),"EBN2",#1/2/2001#,#1/5/2001#,"")
		.AddBar(.AddItem("Task 2"),"EBN",#1/2/2001#,#1/5/2001#,"")
		.AddBar(.AddItem("Task 3"),"EBN2",#1/2/2001#,#1/5/2001#,"")
	End With
	.EndUpdate()
End With
|
|
1196
|
Can I display a shadow for my bars

With Exg2antt1
	.BeginUpdate()
	.Columns.Add("Task")
	.Chart.FirstVisibleDate = #1/1/2001#
	.Chart.set_PaneWidth(False,48)
	.Chart.Bars.Item("Task").Pattern = exontrol.EXG2ANTTLib.PatternEnum.exPatternFrameShadow Or exontrol.EXG2ANTTLib.PatternEnum.exPatternShadow
	With .Items
		.AddBar(.AddItem("Task 1"),"Task",#1/2/2001#,#1/5/2001#,"")
		.AddBar(.AddItem("Task 2"),"Task",#1/2/2001#,#1/5/2001#,"")
	End With
	.EndUpdate()
End With
|
|
1195
|
How can I use the Color property for gradient bars

With Exg2antt1
	.BeginUpdate()
	.Columns.Add("Task")
	.Chart.FirstVisibleDate = #1/1/2001#
	.Chart.set_PaneWidth(False,48)
	With .Chart.Bars.Add("V")
		.Color = Color.FromArgb(255,0,0)
		.StartColor = Color.FromArgb(0,255,0)
		.EndColor = .StartColor
		.Pattern = exontrol.EXG2ANTTLib.PatternEnum.exPatternGradient3Colors Or exontrol.EXG2ANTTLib.PatternEnum.exPatternGradientVBox Or exontrol.EXG2ANTTLib.PatternEnum.exPatternBox
		.Height = -1
	End With
	With .Chart.Bars.Add("H")
		.Color = Color.FromArgb(255,0,0)
		.StartColor = Color.FromArgb(0,255,0)
		.EndColor = .StartColor
		.Pattern = exontrol.EXG2ANTTLib.PatternEnum.exPatternGradient3Colors Or exontrol.EXG2ANTTLib.PatternEnum.exPatternBox
	End With
	With .Items
		.AddBar(.AddItem("Task 1"),"V",#1/2/2001#,#1/5/2001#,"")
		.AddBar(.AddItem("Task 2"),"H",#1/2/2001#,#1/5/2001#,"")
	End With
	.EndUpdate()
End With
|
|
1194
|
Is there any option to show bars with vertical gradient

Dim h
With Exg2antt1
	.Columns.Add("Task")
	.Chart.FirstVisibleDate = #1/1/2001#
	With .Chart.Bars.Item("Task")
		.Color = Color.FromArgb(255,0,0)
		.StartColor = Color.FromArgb(0,255,0)
		.EndColor = Color.FromArgb(255,255,0)
		.Pattern = exontrol.EXG2ANTTLib.PatternEnum.exPatternGradientVBox Or exontrol.EXG2ANTTLib.PatternEnum.exPatternBox
	End With
	With .Items
		h = .AddItem("Task")
		.AddBar(h,"Task",#1/2/2001#,#1/5/2001#,"")
	End With
End With
|
|
1193
|
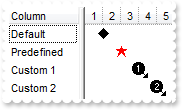
How can I define a new milestone bar
With Exg2antt1
	.BeginUpdate()
	.Images("gBJJgBAIDAAGAAEAAQhYAf8Pf4hh0QihCJo2AEZjQAjEZFEaIEaEEaAIAkcbk0olUrlktl0vmExmUzmk1m03nE5nU7nk9n0/oFBoVDolFo1HpFJpVLplNp1PqFRqVTq" & _
	"lVq1XrFZrVbrldr1fsFhsVjslls1ntFptVrtltt1vuFxuVzul1u13vF5vV7vl9v1/wGBwWDwmFw2HxGJxWLxmNx0xiFdyOTh8Tf9ZymXx+QytcyNgz8r0OblWjyWds+m" & _
	"0ka1Vf1ta1+r1mos2xrG2xeZ0+a0W0qOx3GO4NV3WeyvD2XJ5XL5nN51aiw+lfSj0gkUkAEllHanHI5j/cHg8EZf7w8vl8j4f/qfEZeB09/vjLAB30+kZQAP/P5/H6/y" & _
	"NAOAEAwCjMBwFAEDwJBMDwLBYAP2/8Hv8/gAGAD8LQs9w/nhDY/oygIA=")
	.Chart.FirstVisibleDate = #1/1/2001#
	With .Chart.Bars
		.AddShapeCorner(12345,1)
		.AddShapeCorner(12346,2)
		.Copy("Milestone","M1").StartShape = &H3020 Or exontrol.EXG2ANTTLib.ShapeCornerEnum.exShapeIconVBar Or exontrol.EXG2ANTTLib.ShapeCornerEnum.exShapeIconRight
		.Copy("Milestone","M2").StartShape = &H3020 Or exontrol.EXG2ANTTLib.ShapeCornerEnum.exShapeIconSquare Or exontrol.EXG2ANTTLib.ShapeCornerEnum.exShapeIconRight
		With .Copy("Milestone","MP")
			.StartShape = exontrol.EXG2ANTTLib.ShapeCornerEnum.exShapeIconStar
			.StartColor = Color.FromArgb(255,0,0)
		End With
	End With
	.Columns.Add("Column")
	With .Items
		.AddBar(.AddItem("Default"),"Milestone",#1/2/2001#,#1/2/2001#)
		.AddBar(.AddItem("Predefined"),"MP",#1/3/2001#,#1/3/2001#)
		.AddBar(.AddItem("Custom 1"),"M1",#1/4/2001#,#1/4/2001#)
		.AddBar(.AddItem("Custom 2"),"M2",#1/5/2001#,#1/5/2001#)
	End With
	.EndUpdate()
End With
|
|
1192
|
How can I define my milestone bar, using my icons or pictures
With Exg2antt1
	.Images("gBJJgBAIDAAGAAEAAQhYAf8Pf4hh0QihCJo2AEZjQAjEZFEaIEaEEaAIAkcbk0olUrlktl0vmExmUzmk1m03nE5nU7nk9n0/oFBoVDolFo1HpFJpVLplNp1PqFRqVTq" & _
	"lVq1XrFZrVbrldr1fsFhsVjslls1ntFptVrtltt1vuFxuVzul1u13vF5vV7vl9v1/wGBwWDwmFw2HxGJxWLxmNx0xiFdyOTh8Tf9ZymXx+QytcyNgz8r0OblWjyWds+m" & _
	"0ka1Vf1ta1+r1mos2xrG2xeZ0+a0W0qOx3GO4NV3WeyvD2XJ5XL5nN51aiw+lfSj0gkUkAEllHanHI5j/cHg8EZf7w8vl8j4f/qfEZeB09/vjLAB30+kZQAP/P5/H6/y" & _
	"NAOAEAwCjMBwFAEDwJBMDwLBYAP2/8Hv8/gAGAD8LQs9w/nhDY/oygIA=")
	.Chart.FirstVisibleDate = #1/1/2001#
	With .Chart.Bars
		.AddShapeCorner(12345,1)
		.Item("Milestone").StartShape = &H3020 Or exontrol.EXG2ANTTLib.ShapeCornerEnum.exShapeIconVBar Or exontrol.EXG2ANTTLib.ShapeCornerEnum.exShapeIconRight
	End With
	.Columns.Add("Column")
	With .Items
		.AddBar(.AddItem("Item 1"),"Milestone",#1/2/2001#,#1/2/2001#)
	End With
End With
|
|
1191
|
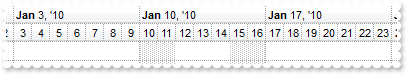
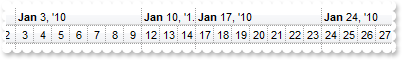
Is it possible to specify manually non-working days instead using the NonworkingDays as being repetitive
With Exg2antt1
	.BeginUpdate()
	With .Chart
		.DrawGridLines = exontrol.EXG2ANTTLib.GridLinesEnum.exAllLines
		.FirstVisibleDate = #1/1/2010#
		.set_PaneWidth(False,0)
		.LevelCount = 2
		.get_Level(0).DrawGridLines = True
		.ShowNonworkingUnits = False
		.ShowNonworkingDates = False
		.NonworkingDays = 0
		.AddNonworkingDate(#1/10/2010#)
		.AddNonworkingDate(#1/11/2010#)
		.AddNonworkingDate(#1/15/2010#)
		.AddNonworkingDate(#1/16/2010#)
	End With
	.EndUpdate()
End With
|
|
1190
|
Is it possible to hide specific days
With Exg2antt1
	.BeginUpdate()
	With .Chart
		.DrawGridLines = exontrol.EXG2ANTTLib.GridLinesEnum.exAllLines
		.FirstVisibleDate = #1/1/2010#
		.set_PaneWidth(False,0)
		.LevelCount = 2
		.get_Level(0).DrawGridLines = True
		.ShowNonworkingUnits = False
		.ShowNonworkingDates = False
		.NonworkingDays = 128
		.AddNonworkingDate(#1/10/2010#)
		.AddNonworkingDate(#1/11/2010#)
		.AddNonworkingDate(#1/15/2010#)
		.AddNonworkingDate(#1/16/2010#)
	End With
	.EndUpdate()
End With
|
|
1189
|
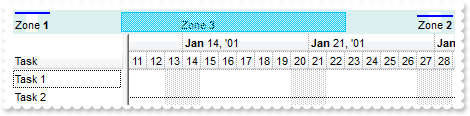
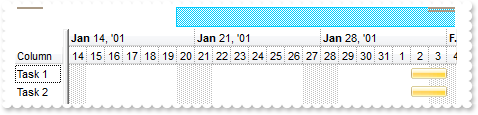
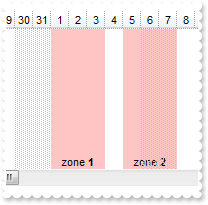
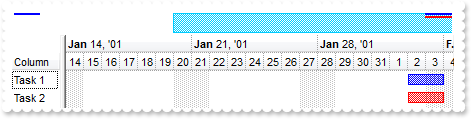
Is it possible to show or display the marked zones ONLY in the overview part of the control
Dim h1,h2
With Exg2antt1
	.BeginUpdate()
	.Columns.Add("Task")
	With .Chart
		.LevelCount = 2
		.FirstVisibleDate = #1/14/2001#
		.set_PaneWidth(False,48)
		.AllowLinkBars = False
		.AllowCreateBar = exontrol.EXG2ANTTLib.CreateBarEnum.exNoCreateBar
		.OverviewVisible = exontrol.EXG2ANTTLib.OverviewVisibleEnum.exOverviewShowAllVisible
		.Bars.Item("Task").Pattern = exontrol.EXG2ANTTLib.PatternEnum.exPatternSolid
		.MarkTimeZone("Z1",#1/3/2001#,#1/4/2001#,.BackColor,";;Zone <b>1</b>")
		.MarkTimeZone("Z2",#2/6/2001#,#2/7/2001#,.BackColor,";;Zone <b>2</b>")
		.MarkTimeZone("Z3",#1/16/2001#,#1/19/2001#,.BackColor,";;Zone <b>3</b>")
		.OverviewShowMarkTimeZones = True
		.OverviewBackColor = Color.FromArgb(220,240,240)
	End With
	With .Items
		h1 = .AddItem("Task 1")
		.AddBar(h1,"Task",#1/2/2001#,#1/5/2001#,"K1")
		h2 = .AddItem("Task 2")
		.AddBar(h2,"Task",#2/5/2001#,#2/8/2001#,"K2")
		.AddLink("L1",h1,"K1",h2,"K2")
	End With
	.EndUpdate()
End With
|
|
1188
|
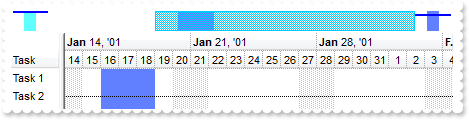
Is it possible to show or display the marked zones in the overview part of the control
Dim h1,h2
With Exg2antt1
	.BeginUpdate()
	.Columns.Add("Task")
	With .Chart
		.LevelCount = 2
		.FirstVisibleDate = #1/14/2001#
		.set_PaneWidth(False,48)
		.AllowLinkBars = False
		.AllowCreateBar = exontrol.EXG2ANTTLib.CreateBarEnum.exNoCreateBar
		.OverviewVisible = exontrol.EXG2ANTTLib.OverviewVisibleEnum.exOverviewShowAllVisible
		.Bars.Item("Task").Pattern = exontrol.EXG2ANTTLib.PatternEnum.exPatternSolid
		.MarkTimeZone("Z1",#1/3/2001#,#1/4/2001#,16777056)
		.MarkTimeZone("Z2",#2/6/2001#,#2/7/2001#,16744544)
		.MarkTimeZone("Z3",#1/16/2001#,#1/19/2001#,16744544)
		.OverviewShowMarkTimeZones = True
	End With
	With .Items
		h1 = .AddItem("Task 1")
		.AddBar(h1,"Task",#1/2/2001#,#1/5/2001#,"K1")
		h2 = .AddItem("Task 2")
		.AddBar(h2,"Task",#2/5/2001#,#2/8/2001#,"K2")
		.AddLink("L1",h1,"K1",h2,"K2")
	End With
	.EndUpdate()
End With
|
|
1187
|
Is there a quick way to determine if a bar belongs to a group
Dim h1,h2,h3
With Exg2antt1
	.Columns.Add("Task")
	With .Chart
		.FirstVisibleDate = #1/1/2001#
		.set_PaneWidth(False,64)
	End With
	With .Items
		h1 = .AddItem("Task 1")
		.AddBar(h1,"Task",#1/2/2001#,#1/4/2001#,"K1")
		h2 = .AddItem("Task 2")
		.AddBar(h2,"Task",#1/5/2001#,#1/7/2001#,"K2")
		h3 = .AddItem("Task 3")
		.AddBar(h3,"Task",#1/5/2001#,#1/7/2001#,"K3")
		.GroupBars(h1,"K1",True,h2,"K2",True)
		.GroupBars(h1,"K1",False,h2,"K2",False)
		.GroupBars(h1,"K1",True,h3,"K3",True)
		.GroupBars(h1,"K1",False,h3,"K3",False)
		Debug.Print( .get_ItemBar(h1,"K1",exontrol.EXG2ANTTLib.ItemBarPropertyEnum.exBarsGroup) )
	End With
End With
|
|
1186
|
I am using the ScrollRange property to limit the chart's visible area, but it does not work as expected. What could be wrong
With Exg2antt1
	.BeginUpdate()
	.Columns.Add("Task")
	With .Chart
		.LevelCount = 2
		.set_PaneWidth(False,56)
		.set_ScrollRange(exontrol.EXG2ANTTLib.ScrollRangeEnum.exStartDate,#1/1/100#)
		.set_ScrollRange(exontrol.EXG2ANTTLib.ScrollRangeEnum.exEndDate,#12/31/9999#)
		.FirstVisibleDate = #4/28/2010#
	End With
	.set_ScrollPartCaption(exontrol.EXG2ANTTLib.ScrollBarEnum.exHChartScroll,exontrol.EXG2ANTTLib.ScrollPartEnum.exLowerBackPart,.Chart.get_ScrollRange(exontrol.EXG2ANTTLib.ScrollRangeEnum.exStartDate))
	.set_ScrollPartCaptionAlignment(exontrol.EXG2ANTTLib.ScrollBarEnum.exHChartScroll,exontrol.EXG2ANTTLib.ScrollPartEnum.exLowerBackPart,exontrol.EXG2ANTTLib.AlignmentEnum.LeftAlignment)
	.set_ScrollPartCaption(exontrol.EXG2ANTTLib.ScrollBarEnum.exHChartScroll,exontrol.EXG2ANTTLib.ScrollPartEnum.exUpperBackPart,.Chart.get_ScrollRange(exontrol.EXG2ANTTLib.ScrollRangeEnum.exEndDate))
	.set_ScrollPartCaptionAlignment(exontrol.EXG2ANTTLib.ScrollBarEnum.exHChartScroll,exontrol.EXG2ANTTLib.ScrollPartEnum.exUpperBackPart,exontrol.EXG2ANTTLib.AlignmentEnum.RightAlignment)
	.EndUpdate()
End With
|
|
1185
|
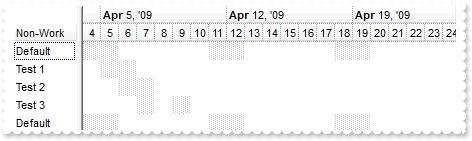
Are you planning to add a AddNonworkingDate / AddNonworkingDay for separate items
With Exg2antt1
	.BeginUpdate()
	.AllowChartScrollPage = True
	.Columns.Add("Non-Work")
	With .Chart
		.FirstVisibleDate = #4/4/2009#
		.set_PaneWidth(False,52)
		.LevelCount = 2
	End With
	With .Items
		.AddItem("Default")
		.set_ItemNonworkingUnits(.AddItem("Test 1"),False,"shortdate(value) in (#4/5/2009#,#4/6/2009#)")
		.set_ItemNonworkingUnits(.AddItem("Test 2"),False,"shortdate(value) in (#4/6/2009#,#4/7/2009#)")
		.set_ItemNonworkingUnits(.AddItem("Test 3"),False,"shortdate(value) in (#4/7/2009#,#4/9/2009#)")
		.AddItem("Default")
	End With
	.EndUpdate()
End With
|
|
1184
|
How can I enlarge the EBN being applied to an object
Dim h
With Exg2antt1
	.BeginUpdate()
	.DefaultItemHeight = 32
	With .VisualAppearance
		.Add(2,"c:\exontrol\images\normal.ebn")
		.Add(1,"CP:2 -3 -2 3 2")
	End With
	With .Chart
		.FirstVisibleDate = #1/1/2002#
		.SelBarColor32 = &H1000000
		.set_PaneWidth(False,48)
	End With
	.Columns.Add("Task")
	With .Items
		h = .AddItem("Task 1")
		.AddBar(h,"Task",#1/2/2002#,#1/4/2002#,"A")
		.AddBar(h,"Task",#1/6/2002#,#1/10/2002#,"B")
		.AddBar(h,"Task",#1/11/2002#,#1/14/2002#,"C")
		.set_ItemBar(h,"A",exontrol.EXG2ANTTLib.ItemBarPropertyEnum.exBarSelected,True)
		.set_ItemBar(h,"B",exontrol.EXG2ANTTLib.ItemBarPropertyEnum.exBarSelected,True)
	End With
	.EndUpdate()
End With
|
|
1183
|
I am using EBN to display my bars but the bars shows in black in the overview area. Is there any option to specify a different color in the overview part of the control
Dim h
With Exg2antt1
	.BeginUpdate()
	.VisualAppearance.Add(1,"c:\exontrol\images\normal.ebn")
	With .Chart
		.Bars.Item("Task").Color32 = &H1000000
		.set_PaneWidth(False,48)
		.OverviewVisible = exontrol.EXG2ANTTLib.OverviewVisibleEnum.exOverviewShowAllVisible
		.FirstVisibleDate = #1/11/2001#
		.LevelCount = 2
	End With
	.Columns.Add("Column")
	With .Items
		h = .AddItem("Task 1")
		.AddBar(h,"Task",#1/2/2001#,#1/4/2001#,1)
		.set_ItemBar(h,1,exontrol.EXG2ANTTLib.ItemBarPropertyEnum.exBarOverviewColor,8821418)
		.AddBar(h,"Task",#2/2/2001#,#2/4/2001#,2)
		.set_ItemBar(h,2,exontrol.EXG2ANTTLib.ItemBarPropertyEnum.exBarOverviewColor,8821418)
		h = .AddItem("Task 2")
		.AddBar(h,"Task",#2/2/2001#,#2/4/2001#,"")
		.set_ItemBar(h,"",exontrol.EXG2ANTTLib.ItemBarPropertyEnum.exBarOverviewColor,8821418)
	End With
	.EndUpdate()
End With
|
|
1182
|
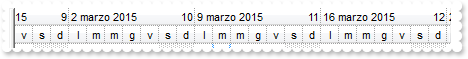
I haven't found options to localize (in Italian) the strings ( dates, tooltip ) that shows in the chart area
With Exg2antt1
.BeginUpdate()
With .Chart
.LevelCount = 2
.set_PaneWidth(False,0)
.set_Label(exontrol.EXG2ANTTLib.UnitEnum.exWeek,"<|><%ww%><|><%d%> <%m3%> '<%yy%><r><%ww%><|><%d%> <%mmmm%> <%yyyy%><r><%ww%><||><||>256")
.set_Label(exontrol.EXG2ANTTLib.UnitEnum.exDay,"<|><%d1%><|><%d2%><|><%d3%><|><%dddd%><|><%d3%> <%d%> <%m3%> '<%yy%><|><%dddd%> <%d%> <%mmmm%> <%yyyy%><||><||>4096")
.set_LabelToolTip(exontrol.EXG2ANTTLib.UnitEnum.exWeek,"<%d%> <%mmmm%> <%yyyy%> <%ww%>")
.set_LabelToolTip(exontrol.EXG2ANTTLib.UnitEnum.exDay,"<%dddd%> <%d%> <%mmmm%> <%yyyy%>")
.FirstWeekDay = exontrol.EXG2ANTTLib.WeekDayEnum.exMonday
.MonthNames = "gennaio febbraio marzo aprile maggio giugno luglio agosto settembre ottobre novembre dicembre"
.WeekDays = "domenica luned� marted� mercoled� gioved� venerd� sabato"
.ToolTip = "<%dddd%> <%d%> <%mmmm%> <%yyyy%>"
.UnitScale = exontrol.EXG2ANTTLib.UnitEnum.exDay
End With
.EndUpdate()
End With
|
|
1181
|
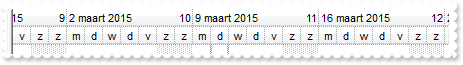
I haven't found options to localize (in Dutch) the strings ( dates, tooltip ) that shows in the chart area
With Exg2antt1
	.BeginUpdate()
	With .Chart
		.LevelCount = 2
		.set_PaneWidth(False,0)
		.set_Label(exontrol.EXG2ANTTLib.UnitEnum.exWeek,"<|><%ww%><|><%d%> <%m3%> '<%yy%><r><%ww%><|><%d%> <%mmmm%> <%yyyy%><r><%ww%><||><||>256")
		.set_Label(exontrol.EXG2ANTTLib.UnitEnum.exDay,"<|><%d1%><|><%d2%><|><%d3%><|><%dddd%><|><%d3%> <%d%> <%m3%> '<%yy%><|><%dddd%> <%d%> <%mmmm%> <%yyyy%><||><||>4096")
		.set_LabelToolTip(exontrol.EXG2ANTTLib.UnitEnum.exWeek,"<%d%> <%mmmm%> <%yyyy%> <%ww%>")
		.set_LabelToolTip(exontrol.EXG2ANTTLib.UnitEnum.exDay,"<%dddd%> <%d%> <%mmmm%> <%yyyy%>")
		.FirstWeekDay = exontrol.EXG2ANTTLib.WeekDayEnum.exMonday
		.MonthNames = "januari februari maart april mei juni juli augusts september oktober november december"
		.WeekDays = "zondag maandag dinsdag woensdag donderdag vrijdag zaterdag"
		.ToolTip = "<%dddd%> <%d%> <%mmmm%> <%yyyy%>"
		.UnitScale = exontrol.EXG2ANTTLib.UnitEnum.exDay
	End With
	.EndUpdate()
End With
|
|
1180
|
I haven't found options to localize (in German) the strings ( dates, tooltip ) that shows in the chart area (method 1)
With Exg2antt1
.BeginUpdate()
With .Chart
.LevelCount = 2
.set_PaneWidth(False,0)
.set_Label(exontrol.EXG2ANTTLib.UnitEnum.exWeek,"<|><%ww%><|><%d%> <%m3%> '<%yy%><r><%ww%><|><%d%>.<%mmmm%> <%yyyy%><r><%ww%><||><||>256")
.set_Label(exontrol.EXG2ANTTLib.UnitEnum.exDay,"<|><%d1%><|><%d2%><|><%d3%><|><%dddd%><|><%d3%> <%d%>.<%m3%> '<%yy%><|><%dddd%> <%d%>.<%mmmm%> <%yyyy%><||><||>4096")
.set_LabelToolTip(exontrol.EXG2ANTTLib.UnitEnum.exWeek,"<%d%>.<%mmmm%> <%yyyy%> <%ww%>")
.set_LabelToolTip(exontrol.EXG2ANTTLib.UnitEnum.exDay,"<%dddd%>, <%d%>.<%mmmm%> <%yyyy%>")
.FirstWeekDay = exontrol.EXG2ANTTLib.WeekDayEnum.exMonday
.MonthNames = "Januar Februar M�rz April Mai Juni Juli August September Oktober November Dezember"
.WeekDays = "Sonntag Montag Dienstag Mittwoch Donnerstag Freitag Samstag"
.ToolTip = "<%dddd%>,<%d%>.<%mmmm%> <%yyyy%>"
.UnitScale = exontrol.EXG2ANTTLib.UnitEnum.exDay
End With
.EndUpdate()
End With
|
|
1179
|
I haven't found options to localize (in French) the strings ( dates, tooltip ) that shows in the chart area
With Exg2antt1
.BeginUpdate()
With .Chart
.LevelCount = 2
.set_PaneWidth(False,0)
.set_Label(exontrol.EXG2ANTTLib.UnitEnum.exWeek,"<|><%ww%><|><%d%> <%m3%> '<%yy%><r><%ww%><|><%d%> <%mmmm%> <%yyyy%><r><%ww%><||><||>256")
.set_Label(exontrol.EXG2ANTTLib.UnitEnum.exDay,"<|><%d1%><|><%d2%><|><%d3%><|><%dddd%><|><%d3%> <%d%> <%m3%> '<%yy%><|><%dddd%> <%d%> <%mmmm%> <%yyyy%><||><||>4096")
.set_LabelToolTip(exontrol.EXG2ANTTLib.UnitEnum.exWeek,"<%d%> <%mmmm%> <%yyyy%> <%ww%>")
.set_LabelToolTip(exontrol.EXG2ANTTLib.UnitEnum.exDay,"<%dddd%> <%d%> <%mmmm%> <%yyyy%>")
.FirstWeekDay = exontrol.EXG2ANTTLib.WeekDayEnum.exMonday
.MonthNames = "janvier f�vrier mars avril mai juin juillet ao�t septembre octobre novembre d�cembre"
.WeekDays = "dimanche lundi mardi mercredi jeudi vendredi samedi"
.ToolTip = "<%dddd%> <%d%> <%mmmm%> <%yyyy%>"
.UnitScale = exontrol.EXG2ANTTLib.UnitEnum.exDay
End With
.EndUpdate()
End With
|
|
1178
|
How can I determine the last visible date in the chart
' MouseMove event - Occurs when the user moves the mouse.
Private Sub Exg2antt1_MouseMoveEvent(ByVal sender As System.Object, ByVal Button As Short, ByVal Shift As Short, ByVal X As Integer, ByVal Y As Integer) Handles Exg2antt1.MouseMoveEvent
	With Exg2antt1
		Debug.Print( "First" )
		Debug.Print( .Chart.FirstVisibleDate )
		Debug.Print( "Last" )
		Debug.Print( .Chart.get_DateFromPoint(1,-1) )
	End With
End Sub

With Exg2antt1
	.BeginUpdate()
	With .Chart
		.LevelCount = 2
		.set_PaneWidth(False,1)
	End With
	.EndUpdate()
End With
|
|
1177
|
How can I filter programatically using more columns
With Exg2antt1
	.BeginUpdate()
	.Chart.set_PaneWidth(True,0)
	.MarkSearchColumn = False
	With .Columns
		.Add("Car")
		.Add("Equipment")
	End With
	With .Items
		.set_CellValue(.AddItem("Mazda"),1,"Air Bag")
		.set_CellValue(.AddItem("Toyota"),1,"Air Bag,Air condition")
		.set_CellValue(.AddItem("Ford"),1,"Air condition")
		.set_CellValue(.AddItem("Nissan"),1,"Air Bag,ABS,ESP")
		.set_CellValue(.AddItem("Mazda"),1,"Air Bag, ABS,ESP")
		.set_CellValue(.AddItem("Mazda"),1,"ABS,ESP")
	End With
	With .Columns.Item("Car")
		.FilterType = exontrol.EXG2ANTTLib.FilterTypeEnum.exFilter
		.Filter = "Mazda"
	End With
	With .Columns.Item("Equipment")
		.FilterType = exontrol.EXG2ANTTLib.FilterTypeEnum.exPattern
		.Filter = "*ABS*|*ESP*"
	End With
	.ApplyFilter()
	.EndUpdate()
End With
|
|
1176
|
Do you have scheduling functionality in Gantt (meaning scheduling several activities (bars) depending on their start and finish dates with considering dependencies to other activities
' BarResize event - Occurs when a bar is moved or resized.
Private Sub Exg2antt1_BarResize(ByVal sender As System.Object, ByVal Item As Integer, ByVal Key As Object) Handles Exg2antt1.BarResize
	With Exg2antt1
		.Items.SchedulePDM(Item,Key)
	End With
End Sub

Dim h1,h2,h3,h4
With Exg2antt1
	.BeginUpdate()
	.Items.AllowCellValueToItemBar = True
	.Columns.Add("Task")
	.Columns.Add("Working").set_Def(exontrol.EXG2ANTTLib.DefColumnEnum.exCellValueToItemBarProperty,258)
	With .Chart
		.Bars.Add("Task:Split").Shortcut = "Task"
		.FirstVisibleDate = #12/28/2000#
		.set_PaneWidth(False,96)
		.AllowLinkBars = False
		.AllowCreateBar = exontrol.EXG2ANTTLib.CreateBarEnum.exNoCreateBar
	End With
	With .Items
		h1 = .AddItem("Task 1")
		.AddBar(h1,"Task",#1/2/2001#,#1/4/2001#,"")
		h2 = .AddItem("Task 2")
		.AddBar(h2,"Task",#1/2/2001#,#1/4/2001#,"")
		.AddLink("L1",h1,"",h2,"")
		h3 = .AddItem("Task 3")
		.AddBar(h3,"Task",#1/2/2001#,#1/6/2001#,"")
		.AddLink("L2",h2,"",h3,"")
		.set_Link("L2",exontrol.EXG2ANTTLib.LinkPropertyEnum.exLinkText,"FF")
		.set_Link("L2",exontrol.EXG2ANTTLib.LinkPropertyEnum.exLinkStartPos,2)
		.set_Link("L2",exontrol.EXG2ANTTLib.LinkPropertyEnum.exLinkEndPos,2)
		h4 = .AddItem("Task 4")
		.AddBar(h4,"Task",#1/2/2001#,#1/4/2001#,"")
		.AddLink("L3",h4,"",h3,"")
		.set_ItemBar(0,"<*>",exontrol.EXG2ANTTLib.ItemBarPropertyEnum.exBarKeepWorkingCount,True)
		.SchedulePDM(.FirstVisibleItem,"")
	End With
	.EndUpdate()
End With
|
|
1175
|
How can I show the ticks for a single slider field
With Exg2antt1
	.BeginUpdate()
	.Columns.Add("Slider").Editor.EditType = exontrol.EXG2ANTTLib.EditTypeEnum.SliderType
	With .Items
		.AddItem(10)
		With .get_CellEditor(.AddItem(20),0)
			.EditType = exontrol.EXG2ANTTLib.EditTypeEnum.SliderType
			.set_Option(exontrol.EXG2ANTTLib.EditorOptionEnum.exSliderTickFrequency,10)
		End With
		.AddItem(30)
	End With
	.EndUpdate()
End With
|
|
1174
|
Is it possible to show ticks for slider fields
With Exg2antt1
	With .Columns.Add("Slider").Editor
		.EditType = exontrol.EXG2ANTTLib.EditTypeEnum.SliderType
		.set_Option(exontrol.EXG2ANTTLib.EditorOptionEnum.exSliderTickFrequency,10)
	End With
	.Items.AddItem(10)
End With
|
|
1173
|
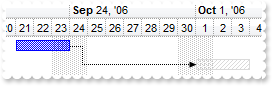
How can I group two bars so the distance between them is limited to a specified range
Dim h1,h2
With Exg2antt1
	.BeginUpdate()
	.Columns.Add("Tasks")
	With .Chart
		.FirstVisibleDate = #9/20/2006#
		.set_PaneWidth(False,48)
		.LevelCount = 2
	End With
	With .Items
		h1 = .AddItem("Task 1")
		.AddBar(h1,"Task",#9/21/2006#,#9/24/2006#)
		h2 = .AddItem("Task 2")
		.AddBar(h2,"Unknown",#9/25/2006#,#9/28/2006#)
		.AddLink("L1",h1,"",h2,"")
		.GroupBars(h1,"",False,h2,"",True,31,"1;2")
		Debug.Print( "The distance between A and B is limited between 1 and 3 days" )
		Debug.Print( "The B is always after the A" )
	End With
	.EndUpdate()
End With
|
|
1172
|
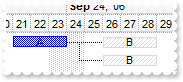
How can I group two bars so the distance between them is flexible but never less than a specified value
Dim h1,h2
With Exg2antt1
	.BeginUpdate()
	.Columns.Add("Tasks")
	With .Chart
		.FirstVisibleDate = #9/20/2006#
		.set_PaneWidth(False,48)
		.LevelCount = 2
	End With
	With .Items
		h1 = .AddItem("Task 1")
		.AddBar(h1,"Task",#9/21/2006#,#9/24/2006#)
		h2 = .AddItem("Task 2")
		.AddBar(h2,"Unknown",#9/26/2006#,#9/29/2006#)
		.AddLink("L1",h1,"",h2,"")
		.GroupBars(h1,"",False,h2,"",True,39,"2")
		Debug.Print( "The distance between A and B is never less than 2 days" )
		Debug.Print( "The B is always after the A" )
	End With
	.EndUpdate()
End With
|
|
1171
|
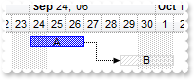
How can I group two bars so the distance between them is flexible
Dim h1,h2
With Exg2antt1
	.BeginUpdate()
	.Columns.Add("Tasks")
	With .Chart
		.FirstVisibleDate = #9/20/2006#
		.set_PaneWidth(False,48)
		.LevelCount = 2
	End With
	With .Items
		h1 = .AddItem("Task 1")
		.AddBar(h1,"Task",#9/21/2006#,#9/24/2006#)
		h2 = .AddItem("Task 2")
		.AddBar(h2,"Unknown",#9/26/2006#,#9/29/2006#)
		.AddLink("L1",h1,"",h2,"")
		.GroupBars(h1,"",False,h2,"",True,39)
		Debug.Print( "The distance between A and B is flexible, unlimited" )
		Debug.Print( "The B is always after the A" )
	End With
	.EndUpdate()
End With
|
|
1170
|
How can I group two bars so the interval between them is fixed
Dim h,h2
With Exg2antt1
	.BeginUpdate()
	.Columns.Add("Tasks")
	With .Chart
		.FirstVisibleDate = #9/20/2006#
		.set_PaneWidth(False,48)
		.LevelCount = 2
	End With
	With .Items
		h = .AddItem("Task 1")
		.AddBar(h,"Task",#9/21/2006#,#9/24/2006#,"T1","A")
		.AddBar(h,"Unknown",#9/26/2006#,#9/29/2006#,"T2","B")
		.AddLink("L",h,"T1",h,"T2")
		.set_Link("L",exontrol.EXG2ANTTLib.LinkPropertyEnum.exLinkGroupBars,27)
		.set_Link("L",exontrol.EXG2ANTTLib.LinkPropertyEnum.exLinkShowDir,False)
		h2 = .AddItem("Task 2")
		.AddBar(h2,"Unknown",#9/26/2006#,#9/29/2006#,"T2","B")
		.AddLink("L2",h,"T1",h2,"T2")
		.set_Link("L2",exontrol.EXG2ANTTLib.LinkPropertyEnum.exLinkGroupBars,27)
		.set_Link("L2",exontrol.EXG2ANTTLib.LinkPropertyEnum.exLinkShowDir,False)
		Debug.Print( "The distance between bars is constant" )
		Debug.Print( "The B is always after the A" )
	End With
	.EndUpdate()
End With
|
|
1169
|
How can I group two bars when linking, so moving the first bar will makes the second to move accordingly
Dim h1,h2
With Exg2antt1
	.BeginUpdate()
	.Columns.Add("Tasks")
	With .Chart
		.FirstVisibleDate = #9/20/2006#
		.set_PaneWidth(False,48)
		.LevelCount = 2
	End With
	With .Items
		h1 = .AddItem("Task 1")
		.AddBar(h1,"Task",#9/21/2006#,#9/24/2006#,"","A")
		h2 = .AddItem("Task 2")
		.AddBar(h2,"Unknown",#9/26/2006#,#9/29/2006#,"","B")
		.AddLink("L1",h1,"",h2,"")
		.set_Link("L1",exontrol.EXG2ANTTLib.LinkPropertyEnum.exLinkGroupBars,39)
		Debug.Print( "The distance between A and B is flexible, unlimited" )
		Debug.Print( "The B is always after the A" )
	End With
	.EndUpdate()
End With
|
|
1168
|
Is it possible to be notified when the user clicks an anchor element a hyperlink in the date-time zone
' AnchorClick event - Occurs when an anchor element is clicked.
Private Sub Exg2antt1_AnchorClick(ByVal sender As System.Object, ByVal AnchorID As String, ByVal Options As String) Handles Exg2antt1.AnchorClick
	With Exg2antt1
		Debug.Print( "Click: " )
		Debug.Print( AnchorID )
	End With
End Sub

With Exg2antt1
	.BeginUpdate()
	With .Chart
		.FirstVisibleDate = #12/28/2000#
		.set_PaneWidth(False,48)
		.MarkTimeZone("Z",#1/2/2001#,#1/5/2001#,15753471,";32;Caption <a1><b>1</b></a>;1;Caption <a2><b>2</b></a>;17;Caption <a3><b>3</b></a>")
	End With
	.EndUpdate()
End With
|
|
1167
|
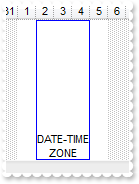
Is it possible to be notified when the user clicks a date-time zone
' Click event - Occurs when the user presses and then releases the left mouse button over the tree control.
Private Sub Exg2antt1_Click(ByVal sender As System.Object) Handles Exg2antt1.Click
	With Exg2antt1
		With .Chart
			Debug.Print( "Click: " )
			Debug.Print( .get_TimeZoneFromPoint(-1,-1) )
		End With
	End With
End Sub

With Exg2antt1
	.BeginUpdate()
	With .Chart
		.FirstVisibleDate = #12/28/2000#
		.set_PaneWidth(False,48)
		.MarkTimeZone("Z",#1/2/2001#,#1/5/2001#,16711680,";32;DATE-TIME<br>    ZONE")
	End With
	.EndUpdate()
End With
|
|
1166
|
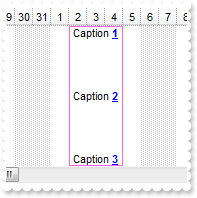
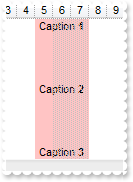
Is is possible to display multiple captions in the same date-time zone
With Exg2antt1
	.BeginUpdate()
	With .Chart
		.FirstVisibleDate = #12/28/2000#
		.set_PaneWidth(False,48)
		.MarkTimeZone("Z",#1/5/2001#,#1/8/2001#,12895487,";;Caption <b>1</b>;1;Caption <b>2</b>;17;Caption <b>3</b>")
	End With
	.EndUpdate()
End With
|
|
1165
|
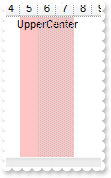
Is is possible to align on the top the caption for the date-time zone
With Exg2antt1
	.BeginUpdate()
	With .Chart
		.FirstVisibleDate = #12/28/2000#
		.set_PaneWidth(False,48)
		.MarkTimeZone("Z",#1/5/2001#,#1/8/2001#,12895487,";;UpperCenter;1")
	End With
	.EndUpdate()
End With
|
|
1164
|
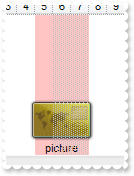
Is there any option to display a picture on the date-time zone
With Exg2antt1
	.BeginUpdate()
	.set_HTMLPicture("pic1","c:\exontrol\images\card.png")
	With .Chart
		.FirstVisibleDate = #12/28/2000#
		.set_PaneWidth(False,48)
		.MarkTimeZone("Z",#1/5/2001#,#1/8/2001#,12895487,";;<c><img>pic1</img><br><c>picture")
	End With
	.EndUpdate()
End With
|
|
1163
|
Is there any option to display a text or a HTML caption on the date-time zone
With Exg2antt1
	.BeginUpdate()
	With .Chart
		.FirstVisibleDate = #12/28/2000#
		.set_PaneWidth(False,48)
		.MarkTimeZone("Z1",#1/1/2001#,#1/4/2001#,12895487,";;zone <b>1</b>")
		.MarkTimeZone("Z2",#1/5/2001#,#1/8/2001#,12895487,";;zone <b>2</b>")
	End With
	.EndUpdate()
End With
|
|
1162
|
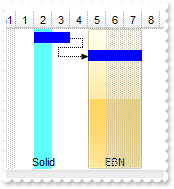
How can I display the date-time zone using a semi-transparent EBN object
Dim h1,h2
With Exg2antt1
	.BeginUpdate()
	.VisualAppearance.Add(1,"c:\exontrol\images\normal.ebn")
	.Columns.Add("Task")
	With .Chart
		.FirstVisibleDate = #12/28/2000#
		.set_PaneWidth(False,48)
		.AllowLinkBars = False
		.AllowCreateBar = exontrol.EXG2ANTTLib.CreateBarEnum.exNoCreateBar
		.Bars.Item("Task").Pattern = exontrol.EXG2ANTTLib.PatternEnum.exPatternSolid
		.MarkTimeZone("Z1",#1/2/2001#,#1/3/2001#,16777056,";;Solid")
		.MarkTimeZone("Z2",#1/7/2001#,#1/10/2001#,16777216,"50;;EBN")
	End With
	With .Items
		h1 = .AddItem("Task 1")
		.AddBar(h1,"Task",#1/2/2001#,#1/4/2001#,"K1")
		h2 = .AddItem("Task 2")
		.AddBar(h2,"Task",#1/5/2001#,#1/8/2001#,"K2")
		.AddLink("L1",h1,"K1",h2,"K2")
	End With
	.EndUpdate()
End With
|
|
1161
|
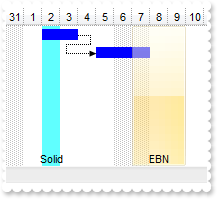
How can I display the date-time zone using an EBN or a skin instead a solid color
Dim h1,h2
With Exg2antt1
	.BeginUpdate()
	.VisualAppearance.Add(1,"c:\exontrol\images\normal.ebn")
	.Columns.Add("Task")
	With .Chart
		.FirstVisibleDate = #12/28/2000#
		.set_PaneWidth(False,48)
		.AllowLinkBars = False
		.AllowCreateBar = exontrol.EXG2ANTTLib.CreateBarEnum.exNoCreateBar
		.Bars.Item("Task").Pattern = exontrol.EXG2ANTTLib.PatternEnum.exPatternSolid
		.MarkTimeZone("Z1",#1/2/2001#,#1/3/2001#,16777056,";;Solid")
		.MarkTimeZone("Z2",#1/5/2001#,#1/8/2001#,16777216,";;EBN")
	End With
	With .Items
		h1 = .AddItem("Task 1")
		.AddBar(h1,"Task",#1/2/2001#,#1/4/2001#,"K1")
		h2 = .AddItem("Task 2")
		.AddBar(h2,"Task",#1/5/2001#,#1/8/2001#,"K2")
		.AddLink("L1",h1,"K1",h2,"K2")
	End With
	.EndUpdate()
End With
|
|
1160
|
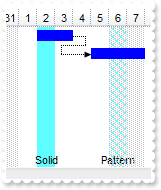
How can I display the date-time zone using a pattern instead a solid color
Dim h1,h2
With Exg2antt1
	.BeginUpdate()
	.Columns.Add("Task")
	With .Chart
		.FirstVisibleDate = #12/28/2000#
		.set_PaneWidth(False,48)
		.AllowLinkBars = False
		.AllowCreateBar = exontrol.EXG2ANTTLib.CreateBarEnum.exNoCreateBar
		.Bars.Item("Task").Pattern = exontrol.EXG2ANTTLib.PatternEnum.exPatternSolid
		.MarkTimeZone("Z1",#1/2/2001#,#1/3/2001#,16777056,";;Solid")
		.MarkTimeZone("Z2",#1/6/2001#,#1/7/2001#,16777056,";12;Pattern")
	End With
	With .Items
		h1 = .AddItem("Task 1")
		.AddBar(h1,"Task",#1/2/2001#,#1/4/2001#,"K1")
		h2 = .AddItem("Task 2")
		.AddBar(h2,"Task",#1/5/2001#,#1/8/2001#,"K2")
		.AddLink("L1",h1,"K1",h2,"K2")
	End With
	.EndUpdate()
End With
|
|
1159
|
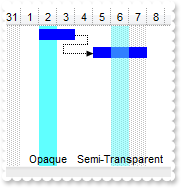
How can I display the date-time zone using a transparent color
Dim h1,h2
With Exg2antt1
	.BeginUpdate()
	.Columns.Add("Task")
	With .Chart
		.FirstVisibleDate = #12/28/2000#
		.set_PaneWidth(False,48)
		.AllowLinkBars = False
		.AllowCreateBar = exontrol.EXG2ANTTLib.CreateBarEnum.exNoCreateBar
		.Bars.Item("Task").Pattern = exontrol.EXG2ANTTLib.PatternEnum.exPatternSolid
		.MarkTimeZone("Z1",#1/2/2001#,#1/3/2001#,16777056,";;Opaque")
		.MarkTimeZone("Z2",#1/6/2001#,#1/7/2001#,16777056,"50;;Semi-Transparent")
	End With
	With .Items
		h1 = .AddItem("Task 1")
		.AddBar(h1,"Task",#1/2/2001#,#1/4/2001#,"K1")
		h2 = .AddItem("Task 2")
		.AddBar(h2,"Task",#1/5/2001#,#1/8/2001#,"K2")
		.AddLink("L1",h1,"K1",h2,"K2")
	End With
	.EndUpdate()
End With
|
|
1158
|
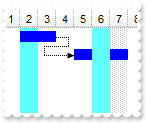
The date time zone is shown behind the bars, is there any way to show it over
Dim h1,h2
With Exg2antt1
	.BeginUpdate()
	.Columns.Add("Task")
	With .Chart
		.FirstVisibleDate = #12/28/2000#
		.set_PaneWidth(False,48)
		.AllowLinkBars = False
		.AllowCreateBar = exontrol.EXG2ANTTLib.CreateBarEnum.exNoCreateBar
		.Bars.Item("Task").Pattern = exontrol.EXG2ANTTLib.PatternEnum.exPatternSolid
		.MarkTimeZone("Z1",#1/2/2001#,#1/3/2001#,16777056)
		.MarkTimeZone("Z2",#1/6/2001#,#1/7/2001#,16777056,"1")
	End With
	With .Items
		h1 = .AddItem("Task 1")
		.AddBar(h1,"Task",#1/2/2001#,#1/4/2001#,"K1")
		h2 = .AddItem("Task 2")
		.AddBar(h2,"Task",#1/5/2001#,#1/8/2001#,"K2")
		.AddLink("L1",h1,"K1",h2,"K2")
	End With
	.EndUpdate()
End With
|
|
1157
|
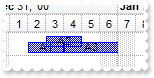
How can I get ifnromation about a date-time zone
' MouseMove event - Occurs when the user moves the mouse.
Private Sub Exg2antt1_MouseMoveEvent(ByVal sender As System.Object, ByVal Button As Short, ByVal Shift As Short, ByVal X As Integer, ByVal Y As Integer) Handles Exg2antt1.MouseMoveEvent
	With Exg2antt1
		With .Chart
			Debug.Print( .get_TimeZoneInfo(.get_TimeZoneFromPoint(-1,-1)) )
		End With
	End With
End Sub

With Exg2antt1
	With .Chart
		.set_PaneWidth(False,18)
		.LevelCount = 2
		.FirstVisibleDate = #1/1/2010#
		.MarkTimeZone("Z1",#1/4/2010#,#1/8/2010#,16744544)
		.MarkTimeZone("Z2",#1/12/2010#,#1/18/2010#,16761952)
	End With
End With
|
|
1156
|
How can I determine the zone from the cursor
' MouseMove event - Occurs when the user moves the mouse.
Private Sub Exg2antt1_MouseMoveEvent(ByVal sender As System.Object, ByVal Button As Short, ByVal Shift As Short, ByVal X As Integer, ByVal Y As Integer) Handles Exg2antt1.MouseMoveEvent
	With Exg2antt1
		With .Chart
			Debug.Print( .get_TimeZoneFromPoint(-1,-1) )
		End With
	End With
End Sub

With Exg2antt1
	With .Chart
		.set_PaneWidth(False,18)
		.LevelCount = 2
		.FirstVisibleDate = #1/1/2010#
		.MarkTimeZone("Z1",#1/4/2010#,#1/8/2010#,16744544)
		.MarkTimeZone("Z2",#1/12/2010#,#1/18/2010#,16761952)
	End With
End With
|
|
1155
|
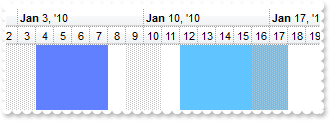
How can I highlight multiple date-time zones (ranges)
With Exg2antt1
	With .Chart
		.set_PaneWidth(False,18)
		.LevelCount = 2
		.FirstVisibleDate = #1/1/2010#
		.MarkTimeZone("Z1",#1/4/2010#,#1/8/2010#,16744544)
		.MarkTimeZone("Z2",#1/12/2010#,#1/18/2010#,16761952)
	End With
End With
|
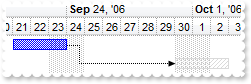
|
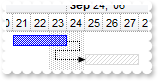
1154
|
How can I highlight a date-time range
With Exg2antt1
With .Chart
.set_PaneWidth(False,18)
.LevelCount = 2
.FirstVisibleDate = #1/1/2010#
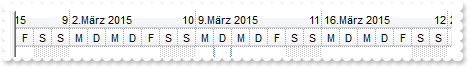
.MarkTimeZone("Z1",#1/4/2010#,#1/8/2010#,16744544)
End With
End With
|
|
1153
|
How do I get the list of selected date
' ChartEndChanging event - Occurs after the chart has been changed.
Private Sub Exg2antt1_ChartEndChanging(ByVal sender As System.Object, ByVal Operation As exontrol.EXG2ANTTLib.BarOperationEnum) Handles Exg2antt1.ChartEndChanging
With Exg2antt1
Debug.Print( Operation )
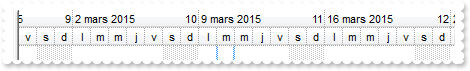
Debug.Print( .Chart.SelectDates )
End With
End Sub
With Exg2antt1
With .Chart
.LevelCount = 2
.set_PaneWidth(False,0)
.MarkTodayColor = .BackColor
End With
End With
|
|
1152
|
Is there any function I can use to find the bars that intersect with the current bar
' BarResizing event - Occurs when a bar is moving or resizing.
Private Sub Exg2antt1_BarResizing(ByVal sender As System.Object, ByVal Item As Integer, ByVal Key As Object) Handles Exg2antt1.BarResizing
	With Exg2antt1
		With .Items
			Debug.Print( Key )
			Debug.Print( "intesect with" )
			Debug.Print( .get_ItemBar(Item,Key,exontrol.EXG2ANTTLib.ItemBarPropertyEnum.exBarIntersectWithAsString) )
		End With
	End With
End Sub

Dim h1
With Exg2antt1
	.BeginUpdate()
	.DefaultItemHeight = 22
	.Columns.Add("Task")
	.ScrollBySingleLine = True
	.DrawGridLines = exontrol.EXG2ANTTLib.GridLinesEnum.exAllLines
	With .Chart
		.DrawGridLines = exontrol.EXG2ANTTLib.GridLinesEnum.exAllLines
		.set_PaneWidth(False,48)
		.FirstVisibleDate = #12/28/2000#
		.LevelCount = 2
		.Bars.Item("Task").OverlaidType = exontrol.EXG2ANTTLib.OverlaidBarsTypeEnum.exOverlaidBarsOffset
		.ResizeUnitScale = exontrol.EXG2ANTTLib.UnitEnum.exHour
		.AllowCreateBar = exontrol.EXG2ANTTLib.CreateBarEnum.exCreateBarAuto
	End With
	With .Items
		h1 = .AddItem("Default")
		.AddBar(h1,"Task",#1/2/2001#,#1/4/2001#,"A1","A1")
		.AddBar(h1,"Task",#1/3/2001#,#1/5/2001#,"A2","A2")
		.AddBar(h1,"Task",#1/4/2001#,#1/7/2001#,"A3","A3")
	End With
	.EndUpdate()
End With
|
|
1151
|
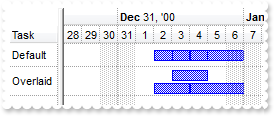
Is it possible to order the bars on top of other bars
Dim h1,h2
With Exg2antt1
	.BeginUpdate()
	.DefaultItemHeight = 22
	.Columns.Add("Task")
	.ScrollBySingleLine = True
	.DrawGridLines = exontrol.EXG2ANTTLib.GridLinesEnum.exAllLines
	With .Chart
		.DrawGridLines = exontrol.EXG2ANTTLib.GridLinesEnum.exAllLines
		.set_PaneWidth(False,48)
		.FirstVisibleDate = #12/28/2000#
		.LevelCount = 2
		.Bars.Copy("Task","NTask").OverlaidType = exontrol.EXG2ANTTLib.OverlaidBarsTypeEnum.exOverlaidBarsOffset
	End With
	With .Items
		h1 = .AddItem("Default")
		.AddBar(h1,"Task",#1/2/2001#,#1/4/2001#,"A1")
		.AddBar(h1,"Task",#1/3/2001#,#1/5/2001#,"A2")
		.AddBar(h1,"Task",#1/4/2001#,#1/7/2001#,"A3")
		h2 = .AddItem("Overlaid")
		.AddBar(h2,"NTask",#1/2/2001#,#1/4/2001#,"A1")
		.AddBar(h2,"NTask",#1/3/2001#,#1/5/2001#,"A2")
		.AddBar(h2,"NTask",#1/4/2001#,#1/7/2001#,"A3")
		.GroupBars(h1,"A1",True,h2,"A1",True)
		.GroupBars(h1,"A1",False,h2,"A1",False)
		.GroupBars(h1,"A2",True,h2,"A2",True)
		.GroupBars(h1,"A2",False,h2,"A2",False)
		.GroupBars(h1,"A3",True,h2,"A3",True)
		.GroupBars(h1,"A3",False,h2,"A3",False)
	End With
	.EndUpdate()
End With
|
|
1150
|
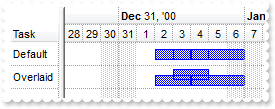
Is it possible to order the bars on top of other bars (have different colurs so that they can be seen)
Dim h1,h2
With Exg2antt1
	.BeginUpdate()
	.DefaultItemHeight = 22
	.Columns.Add("Task")
	.ScrollBySingleLine = True
	.DrawGridLines = exontrol.EXG2ANTTLib.GridLinesEnum.exAllLines
	With .Chart
		.DrawGridLines = exontrol.EXG2ANTTLib.GridLinesEnum.exAllLines
		.set_PaneWidth(False,48)
		.FirstVisibleDate = #12/28/2000#
		.LevelCount = 2
		.Bars.Copy("Task","NTask").OverlaidType = exontrol.EXG2ANTTLib.OverlaidBarsTypeEnum.exOverlaidBarsStackAutoArrange Or exontrol.EXG2ANTTLib.OverlaidBarsTypeEnum.exOverlaidBarsStack
	End With
	With .Items
		h1 = .AddItem("Default")
		.AddBar(h1,"Task",#1/2/2001#,#1/4/2001#,"A1")
		.AddBar(h1,"Task",#1/3/2001#,#1/5/2001#,"A2")
		.AddBar(h1,"Task",#1/4/2001#,#1/7/2001#,"A3")
		h2 = .AddItem("Overlaid")
		.AddBar(h2,"NTask",#1/2/2001#,#1/4/2001#,"A1")
		.AddBar(h2,"NTask",#1/3/2001#,#1/5/2001#,"A2")
		.AddBar(h2,"NTask",#1/4/2001#,#1/7/2001#,"A3")
		.GroupBars(h1,"A1",True,h2,"A1",True)
		.GroupBars(h1,"A1",False,h2,"A1",False)
		.GroupBars(h1,"A2",True,h2,"A2",True)
		.GroupBars(h1,"A2",False,h2,"A2",False)
		.GroupBars(h1,"A3",True,h2,"A3",True)
		.GroupBars(h1,"A3",False,h2,"A3",False)
	End With
	.EndUpdate()
End With
|
|
1149
|
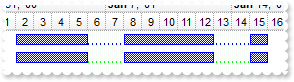
Is it possible to layer bars on top of other bars (have different colurs so that they can be seen)
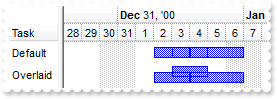
Dim h1,h2
With Exg2antt1
.BeginUpdate()
.DefaultItemHeight = 22
.Columns.Add("Task")
With .Chart
.set_PaneWidth(False,48)
.FirstVisibleDate = #12/28/2000#
.LevelCount = 2
.Bars.Copy("Task","NTask").OverlaidType = exontrol.EXG2ANTTLib.OverlaidBarsTypeEnum.exOverlaidBarsOffset
End With
With .Items
h1 = .AddItem("Default")
.AddBar(h1,"Task",#1/2/2001#,#1/4/2001#,"A1")
.AddBar(h1,"Task",#1/3/2001#,#1/5/2001#,"A2")
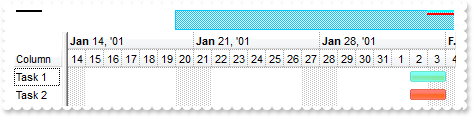
.AddBar(h1,"Task",#1/4/2001#,#1/7/2001#,"A3")
h2 = .AddItem("Overlaid")
.AddBar(h2,"NTask",#1/2/2001#,#1/4/2001#,"A1")
.AddBar(h2,"NTask",#1/3/2001#,#1/5/2001#,"A2")
.AddBar(h2,"NTask",#1/4/2001#,#1/7/2001#,"A3")
.GroupBars(h1,"A1",True,h2,"A1",True)
.GroupBars(h1,"A1",False,h2,"A1",False)
.GroupBars(h1,"A2",True,h2,"A2",True)
.GroupBars(h1,"A2",False,h2,"A2",False)
.GroupBars(h1,"A3",True,h2,"A3",True)
.GroupBars(h1,"A3",False,h2,"A3",False)
End With
.EndUpdate()
End With
|
|
1148
|
My skin(EBN) bars are not shown a different color in the overview. What can I do
Dim h
With Exg2antt1
	.BeginUpdate()
	.VisualAppearance.Add(1,"c:\exontrol\images\normal.ebn")
	With .Chart
		.Bars.Item("Task").Color32 = &H1000000
		.set_PaneWidth(False,48)
		.OverviewVisible = exontrol.EXG2ANTTLib.OverviewVisibleEnum.exOverviewShowAllVisible
		.FirstVisibleDate = #1/11/2001#
		.LevelCount = 2
	End With
	.Columns.Add("Column")
	With .Items
		h = .AddItem("Task 1")
		.AddBar(h,"Task",#1/2/2001#,#1/4/2001#,1)
		.AddBar(h,"Task",#2/2/2001#,#2/4/2001#,2)
		.set_ItemBar(h,2,exontrol.EXG2ANTTLib.ItemBarPropertyEnum.exBarColor,16776960)
		h = .AddItem("Task 2")
		.AddBar(h,"Task",#2/2/2001#,#2/4/2001#,"")
		.set_ItemBar(h,"",exontrol.EXG2ANTTLib.ItemBarPropertyEnum.exBarColor,255)
	End With
	.EndUpdate()
End With
|
|
1147
|
How do I colour the lines in the overview section to match the bars they represent on the main chart
Dim h
With Exg2antt1
	.BeginUpdate()
	With .Chart
		.set_PaneWidth(False,48)
		.OverviewVisible = exontrol.EXG2ANTTLib.OverviewVisibleEnum.exOverviewShowAllVisible
		.FirstVisibleDate = #1/1/2001#
		.LevelCount = 2
	End With
	.Columns.Add("Column")
	With .Items
		h = .AddItem("Task 1")
		.AddBar(h,"Task",#1/2/2001#,#1/4/2001#,1)
		.AddBar(h,"Task",#2/2/2001#,#2/4/2001#,2)
		h = .AddItem("Task 2")
		.AddBar(h,"Task",#2/2/2001#,#2/4/2001#,"")
		.set_ItemBar(h,"",exontrol.EXG2ANTTLib.ItemBarPropertyEnum.exBarColor,255)
	End With
	.EndUpdate()
End With
|
|
1146
|
How do I catch the delete key (down) on a bar
' KeyDown event - Occurs when the user presses a key while an object has the focus.
Private Sub Exg2antt1_KeyDown(ByVal sender As System.Object, ByRef KeyCode As Short, ByVal Shift As Short) Handles Exg2antt1.KeyDown
	With Exg2antt1
		Debug.Print( KeyCode )
		Debug.Print( Shift )
	End With
End Sub

Dim h
With Exg2antt1
	.BeginUpdate()
	.Columns.Add("Task")
	With .Chart
		.FirstVisibleDate = #12/27/2000#
		.LevelCount = 2
		.set_PaneWidth(False,48)
		With .Bars.Item("Task")
			.Pattern = exontrol.EXG2ANTTLib.PatternEnum.exPatternBox
			.Height = 13
		End With
	End With
	With .Items
		h = .AddItem("Task 1")
		.AddBar(h,"Task",#1/2/2001#,#1/6/2001#,"K1","This is a bit of text that is not clipped")
		h = .AddItem("Task 1")
		.AddBar(h,"Task",#1/2/2001#,#1/6/2001#,"K1","This is a bit of text that get's clipped")
		.set_ItemBar(h,"K1",exontrol.EXG2ANTTLib.ItemBarPropertyEnum.exBarHAlignCaption,3)
		.set_ItemBar(h,"K1",exontrol.EXG2ANTTLib.ItemBarPropertyEnum.exBarToolTip,.get_ItemBar(h,"K1",exontrol.EXG2ANTTLib.ItemBarPropertyEnum.exBarCaption))
	End With
	.EndUpdate()
End With
|
|
1145
|
Is it possible to colour a particular column, I mean the cell's foreground color
With Exg2antt1
	.BeginUpdate()
	With .ConditionalFormats.Add("1")
		.ForeColor = Color.FromArgb(255,0,0)
		.ApplyTo = &H1
	End With
	.MarkSearchColumn = False
	With .Columns
		.Add("Column 1")
		.Add("Column 2")
	End With
	With .Items
		.set_CellValue(.AddItem(0),1,1)
		.set_CellValue(.AddItem(2),1,3)
		.set_CellValue(.AddItem(4),1,5)
	End With
	.EndUpdate()
End With
|
|
1144
|
Is it possible to colour a particular column for specified values
With Exg2antt1
	.BeginUpdate()
	With .ConditionalFormats.Add("int(%1) in (3,4,5)")
		.BackColor = Color.FromArgb(255,0,0)
		.ApplyTo = &H1
	End With
	.MarkSearchColumn = False
	With .Columns
		.Add("Column 1")
		.Add("Column 2")
	End With
	With .Items
		.set_CellValue(.AddItem(0),1,1)
		.set_CellValue(.AddItem(2),1,3)
		.set_CellValue(.AddItem(4),1,5)
	End With
	.EndUpdate()
End With
|
|
1143
|
Is it possible to colour a particular column
With Exg2antt1
	.BeginUpdate()
	.MarkSearchColumn = False
	With .Columns
		.Add("Column 1")
		.Add("Column 2").set_Def(exontrol.EXG2ANTTLib.DefColumnEnum.exCellBackColor,255)
	End With
	With .Items
		.set_CellValue(.AddItem(0),1,1)
		.set_CellValue(.AddItem(2),1,3)
		.set_CellValue(.AddItem(4),1,5)
	End With
	.EndUpdate()
End With
|
|
1142
|
How do i get all the children items that are under a certain parent Item handle
Dim h,hChild
With Exg2antt1
	.BeginUpdate()
	.LinesAtRoot = exontrol.EXG2ANTTLib.LinesAtRootEnum.exLinesAtRoot
	.Columns.Add("P")
	With .Items
		h = .AddItem("Root")
		.InsertItem(h,Nothing,"Child 1")
		.InsertItem(h,Nothing,"Child 2")
		.set_ExpandItem(h,True)
	End With
	With .Items
		hChild = .get_ItemChild(.FirstVisibleItem)
		Debug.Print( .get_CellValue(hChild,0) )
		Debug.Print( .get_CellValue(.get_NextSiblingItem(hChild),0) )
	End With
	.EndUpdate()
End With
|
|
1141
|
How can I access the control's scroll bar so I can change its appearance
With Exg2antt1
	.BeginUpdate()
	.Chart.set_PaneWidth(False,0)
	.VisualAppearance.Add(1,"c:\exontrol\images\normal.ebn")
	.set_Background32(exontrol.EXG2ANTTLib.BackgroundPartEnum.exHSThumb,&H1000000)
	.EndUpdate()
End With
|
|
1140
|
How can I show my bars using the parts of the current theme
With Exg2antt1
	.BeginUpdate()
	With .VisualAppearance
		.Add(1,"XP:Button 1 1")
		.Add(2,"XP:Button 1 2")
		.Add(3,"XP:ScrollBar 3 1")
		.Add(4,"XP:ScrollBar 3 2")
	End With
	With .Chart
		.set_PaneWidth(False,48)
		.FirstVisibleDate = #1/1/2001#
		With .Bars
			.Add("B1").Color32 = &H1000000
			.Add("B2").Color32 = &H2000000
			.Add("S1").Color32 = &H3000000
			.Add("S2").Color32 = &H4000000
		End With
	End With
	.Columns.Add("Column")
	With .Items
		.AddBar(.AddItem("Button1"),"B1",#1/2/2001#,#1/4/2001#)
		.AddBar(.AddItem("Button 2"),"B2",#1/2/2001#,#1/4/2001#)
		.AddBar(.AddItem("Scrollbar 1"),"S1",#1/2/2001#,#1/4/2001#)
		.AddBar(.AddItem("Scrollbar 2"),"S2",#1/2/2001#,#1/4/2001#)
	End With
	.EndUpdate()
End With
|
|
1139
|
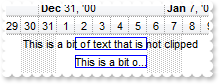
How do I hide the text on a bar if the text is to big for the bar length
Dim h
With Exg2antt1
	.Columns.Add("Task")
	With .Chart
		.FirstVisibleDate = #12/27/2000#
		.LevelCount = 2
		.set_PaneWidth(False,48)
		With .Bars.Item("Task")
			.Pattern = exontrol.EXG2ANTTLib.PatternEnum.exPatternBox
			.Height = 13
		End With
	End With
	With .Items
		h = .AddItem("Task 1")
		.AddBar(h,"Task",#1/2/2001#,#1/6/2001#,"K1","This is a bit of text that is not clipped")
		h = .AddItem("Task 1")
		.AddBar(h,"Task",#1/2/2001#,#1/6/2001#,"K1","This is a bit of text that get's clipped")
		.set_ItemBar(h,"K1",exontrol.EXG2ANTTLib.ItemBarPropertyEnum.exBarHAlignCaption,3)
		.set_ItemBar(h,"K1",exontrol.EXG2ANTTLib.ItemBarPropertyEnum.exBarToolTip,.get_ItemBar(h,"K1",exontrol.EXG2ANTTLib.ItemBarPropertyEnum.exBarCaption))
	End With
End With
|
|
1138
|
Is it possible to change the color for non-working parts of the bar
Dim h
With Exg2antt1
	.BeginUpdate()
	.Columns.Add("Task")
	With .Chart
		.LevelCount = 2
		.set_PaneWidth(False,48)
		.FirstVisibleDate = #1/1/2001#
		.Bars.Add("Task:Split").Shortcut = "Task"
		.NonworkingDaysColor = Color.FromArgb(240,250,240)
	End With
	With .Items
		.AddBar(.AddItem("Task 1"),"Task",#1/2/2001#,#1/16/2001#)
		h = .AddItem("Task 2")
		.AddBar(h,"Task",#1/2/2001#,#1/16/2001#,"")
		.set_ItemBar(h,"",exontrol.EXG2ANTTLib.ItemBarPropertyEnum.exBarNonWorkingColor,65280)
	End With
	.EndUpdate()
End With
|
|
1137
|
Is it possible to change the color for the percent bar being displayed inside a specified bar only
Dim h
With Exg2antt1
	.Columns.Add("Task")
	.Chart.FirstVisibleDate = #1/1/2001#
	.Chart.Bars.Add("Task%Progress")
	.Chart.set_PaneWidth(False,48)
	With .Items
		h = .AddItem("Task 1")
		.AddBar(h,"Task%Progress",#1/2/2001#,#1/6/2001#,"K1")
		.set_ItemBar(h,"K1",exontrol.EXG2ANTTLib.ItemBarPropertyEnum.exBarPercent,0.4)
		h = .AddItem("Task 2")
		.AddBar(h,"Task%Progress",#1/2/2001#,#1/6/2001#,"K1")
		.set_ItemBar(h,"K1",exontrol.EXG2ANTTLib.ItemBarPropertyEnum.exBarPercent,0.5)
		.set_ItemBar(h,"K1",exontrol.EXG2ANTTLib.ItemBarPropertyEnum.exBarPercentColor,255)
	End With
End With
|
|
1136
|
How do I get a handle on the item before adding the bar
Dim h,h1,h2,h3
With Exg2antt1
	.BeginUpdate()
	.MarkSearchColumn = False
	.OnResizeControl = exontrol.EXG2ANTTLib.OnResizeControlEnum.exResizeChart
	.Columns.Add("Tasks")
	.Columns.Add("Start").Visible = False
	.Columns.Add("End").Visible = False
	With .Chart
		.FirstVisibleDate = #9/20/2006#
		.set_PaneWidth(False,64)
		.LevelCount = 2
	End With
	With .Items
		h1 = .AddItem("Task 0")
		.set_CellValue(h1,1,#9/21/2006#)
		.set_CellValue(h1,2,#9/24/2006#)
		.AddBar(h1,"Task",.get_CellValue(h1,1),.get_CellValue(h1,2))
		h2 = .InsertItem(h,Nothing,"Task 1")
		.set_CellValue(h2,1,#9/25/2006#)
		.set_CellValue(h2,2,#9/28/2006#)
		.AddBar(h2,"Task",.get_CellValue(h2,1),.get_CellValue(h2,2))
		h3 = .InsertItem(h,Nothing,"Task 2")
		.set_CellValue(h3,1,#9/29/2006#)
		.set_CellValue(h3,2,#10/2/2006#)
		.AddBar(h3,"Task",.get_CellValue(h3,1),.get_CellValue(h3,2))
		.AddItem(.ItemCount)
	End With
	.EndUpdate()
End With
|
|
1135
|
Is there an Items method that I can use to loop around to compare the item's user data against
Dim h
With Exg2antt1
	.Columns.Add("Default")
	With .Items
		h = .AddItem("Root 1")
		.InsertItem(h,Nothing,"Child 1")
		.set_ItemData(.InsertItem(h,Nothing,"Child 2"),1234)
		.set_ExpandItem(h,True)
		.set_ItemBold(.get_FindItemData(1234),True)
	End With
End With
|
|
1134
|
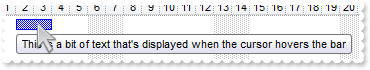
How do I make the tooltip box wider to allow for longer text
Dim h
With Exg2antt1
	.ToolTipWidth = 328
	.Columns.Add("Task")
	With .Chart
		.FirstVisibleDate = #1/1/2001#
		.set_PaneWidth(False,48)
	End With
	With .Items
		h = .AddItem("Task 1")
		.AddBar(h,"Task",#1/2/2001#,#1/4/2001#,"K1")
		.set_ItemBar(h,"K1",exontrol.EXG2ANTTLib.ItemBarPropertyEnum.exBarToolTip,"This is a bit of text that's displayed when the cursor hovers the bar")
	End With
End With
|
|
1133
|
How do i set the default timeslots to say hours or minutes
With Exg2antt1
.BeginUpdate()
With .Chart
.FirstVisibleDate = #1/1/2001#
.set_PaneWidth(False,48)
.OverviewVisible = exontrol.EXG2ANTTLib.OverviewVisibleEnum.exOverviewShowAllVisible
.LevelCount = 2
.AllowOverviewZoom = exontrol.EXG2ANTTLib.OverviewZoomEnum.exAlwaysZoom
.OverviewZoomUnit = 24
.OverviewZoomCaption = "Y|�Y|�Y|Mo|T|W|D|H|Mi|S"
.UnitScale = exontrol.EXG2ANTTLib.UnitEnum.exMinute
End With
.Columns.Add("Column")
With .Items
.AddBar(.AddItem("Item 1"),"Task",#1/2/2001#,#1/4/2001#)
.AddBar(.AddItem("Item 2"),"Task",#1/16/2001#,#1/25/2001#)
.AddBar(.AddItem("Item 3"),"Task",#1/2/2001#,#1/4/2001#)
.AddBar(.AddItem("Item 4"),"Task",#2/16/2001#,#2/25/2001#)
End With
.EndUpdate()
End With
|
|
1132
|
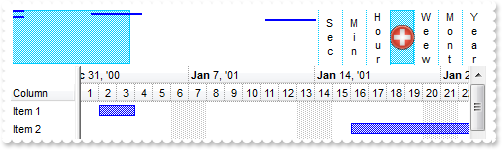
Can I use icons or images in the text in the overview zoom buttons (Sec., Min., Hour, Month...)
With Exg2antt1
.BeginUpdate()
.set_HTMLPicture("pic1","c:\exontrol\images\zipdisk.gif")
With .Chart
.FirstVisibleDate = #1/1/2001#
.set_PaneWidth(False,48)
.OverviewVisible = exontrol.EXG2ANTTLib.OverviewVisibleEnum.exOverviewShowAllVisible
.LevelCount = 2
.AllowOverviewZoom = exontrol.EXG2ANTTLib.OverviewZoomEnum.exAlwaysZoom
.OverviewZoomUnit = 24
.OverviewHeight = 58
.OverviewZoomCaption = "Y<br>e<br>a<br>r|�Y|�Y|M<br>o<br>n<br>t<br>h|T|W<br>e<br>e<br>w|<img>pic1:28<img>|H<br>o<br>u<br>r|M<br>i<br>n|S<br>e<br>c"
End With
.Columns.Add("Column")
With .Items
.AddBar(.AddItem("Item 1"),"Task",#1/2/2001#,#1/4/2001#)
.AddBar(.AddItem("Item 2"),"Task",#1/16/2001#,#1/25/2001#)
.AddBar(.AddItem("Item 3"),"Task",#1/2/2001#,#1/4/2001#)
.AddBar(.AddItem("Item 4"),"Task",#2/16/2001#,#2/25/2001#)
End With
.EndUpdate()
End With
|
|
1131
|
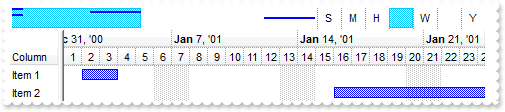
Can I use icons or images in the text in the overview zoom buttons (Sec., Min., Hour, Month...)
With Exg2antt1
.BeginUpdate()
.Images("gBJJgBAIDAAGAAEAAQhYAf8Pf4hh0QihCJo2AEZjQAjEZFEaIEaEEaAIAkcbk0olUrlktl0vmExmUzmk1m03nE5nU7nk9n0/oFBoVDolFo1HpFJpVLplNp1PqFRqVTq" & _
"lVq1XrFZrVbrldr1fsFhsVjslls1ntFptVrtltt1vuFxuVzul1u13vF5vV7vl9v1/wGBwWDwmFw2HxGJxWLxmNx0xiFdyOTh8Tf9ZymXx+QytcyNgz8r0OblWjyWds+m" & _
"0ka1Vf1ta1+r1mos2xrG2xeZ0+a0W0qOx3GO4NV3WeyvD2XJ5XL5nN51aiw+lfSj0gkUkAEllHanHI5j/cHg8EZf7w8vl8j4f/qfEZeB09/vjLAB30+kZQAP/P5/H6/y" & _
"NAOAEAwCjMBwFAEDwJBMDwLBYAP2/8Hv8/gAGAD8LQs9w/nhDY/oygIA=")
With .Chart
.FirstVisibleDate = #1/1/2001#
.set_PaneWidth(False,48)
.OverviewVisible = exontrol.EXG2ANTTLib.OverviewVisibleEnum.exOverviewShowAllVisible
.LevelCount = 2
.AllowOverviewZoom = exontrol.EXG2ANTTLib.OverviewZoomEnum.exAlwaysZoom
.OverviewZoomUnit = 24
.OverviewZoomCaption = "Y|�Y|�Y|<img>2<img>|T|W|<img>1<img>|H|M|S"
End With
.Columns.Add("Column")
With .Items
.AddBar(.AddItem("Item 1"),"Task",#1/2/2001#,#1/4/2001#)
.AddBar(.AddItem("Item 2"),"Task",#1/16/2001#,#1/25/2001#)
.AddBar(.AddItem("Item 3"),"Task",#1/2/2001#,#1/4/2001#)
.AddBar(.AddItem("Item 4"),"Task",#2/16/2001#,#2/25/2001#)
End With
.EndUpdate()
End With
|
|
1130
|
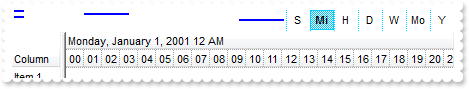
How do I change (for localisation) the text in the buttons like (Sec., Min., Hour, Month...)
With Exg2antt1
.BeginUpdate()
With .Chart
.FirstVisibleDate = #1/1/2001#
.set_PaneWidth(False,48)
.OverviewVisible = exontrol.EXG2ANTTLib.OverviewVisibleEnum.exOverviewShowAllVisible
.LevelCount = 2
.AllowOverviewZoom = exontrol.EXG2ANTTLib.OverviewZoomEnum.exAlwaysZoom
.OverviewZoomUnit = 24
.OverviewZoomCaption = "Y|�Y|�Y|Mo|T|W|D|H|Mi|S"
End With
.Columns.Add("Column")
With .Items
.AddBar(.AddItem("Item 1"),"Task",#1/2/2001#,#1/4/2001#)
.AddBar(.AddItem("Item 2"),"Task",#1/16/2001#,#1/25/2001#)
.AddBar(.AddItem("Item 3"),"Task",#1/2/2001#,#1/4/2001#)
.AddBar(.AddItem("Item 4"),"Task",#2/16/2001#,#2/25/2001#)
End With
.EndUpdate()
End With
|
|
1129
|
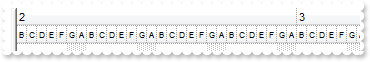
How I can change the Months and Weekdays
With Exg2antt1
	.BeginUpdate()
	With .Chart
		.set_PaneWidth(False,0)
		.FirstVisibleDate = #2/1/2010#
		.LevelCount = 2
		.UnitWidth = 10
		.MonthNames = "1 2 3 4 5 6 7 8 9 10 11 12"
		.WeekDays = "A B C D E F G"
		With .get_Level(0)
			.Label = "<%mmmm%>"
			.Unit = exontrol.EXG2ANTTLib.UnitEnum.exMonth
		End With
		With .get_Level(1)
			.Label = "<font ;6><%ddd%>"
			.Unit = exontrol.EXG2ANTTLib.UnitEnum.exDay
		End With
	End With
	.EndUpdate()
End With
|
|
1128
|
How do i get the current window time frame (the start and end) of the gantt chart
' DateChange event - Occurs when the first visible date is changed.
Private Sub Exg2antt1_DateChange(ByVal sender As System.Object) Handles Exg2antt1.DateChange
	With Exg2antt1
		With .Chart
			Debug.Print( "Start" )
			Debug.Print( .FirstVisibleDate )
			Debug.Print( "" )
			Debug.Print( "End" )
			Debug.Print( .get_DateFromPoint(.get_PaneWidth(True),0) )
		End With
	End With
End Sub

With Exg2antt1
	.BeginUpdate()
	With .Chart
		.set_PaneWidth(False,1)
		.LevelCount = 2
		.ScrollTo(#1/1/2010#,0)
	End With
	.EndUpdate()
End With
|
|
1127
|
When I use this Chart.get_DateFromPoint(exg2antt1.Width, 0) I get date as 0, 30/12/1899, or 12:00:00 AM. What that means
' MouseMove event - Occurs when the user moves the mouse.
Private Sub Exg2antt1_MouseMoveEvent(ByVal sender As System.Object, ByVal Button As Short, ByVal Shift As Short, ByVal X As Integer, ByVal Y As Integer) Handles Exg2antt1.MouseMoveEvent
	With Exg2antt1
		Debug.Print( .Chart.get_DateFromPoint(-1,-1) )
	End With
End Sub

With Exg2antt1
	With .Chart
		.set_PaneWidth(False,48)
		.LevelCount = 2
	End With
End With
|
|
1126
|
How do I enable grabing bars to other items/rows (and only enable them to be dropped on certain rows)
' BarParentChange event - Occurs just before moving a bar from current item to another item.
Private Sub Exg2antt1_BarParentChange(ByVal sender As System.Object, ByVal Item As Integer, ByVal Key As Object, ByVal NewItem As Integer, ByRef Cancel As Boolean) Handles Exg2antt1.BarParentChange
	With Exg2antt1
		Debug.Print( .Items.get_CellCaption(NewItem,0) )
		Cancel = .Items.get_ItemData(NewItem)
	End With
End Sub

Dim h
With Exg2antt1
	.BeginUpdate()
	With .Chart
		.FirstVisibleDate = #1/1/2001#
		.set_PaneWidth(False,48)
		.AllowLinkBars = False
		.Bars.Item("Task").OverlaidType = exontrol.EXG2ANTTLib.OverlaidBarsTypeEnum.exOverlaidBarsTransparent Or exontrol.EXG2ANTTLib.OverlaidBarsTypeEnum.exOverlaidBarsOffset
	End With
	.Columns.Add("Column")
	With .Items
		h = .AddItem("Item 1")
		.set_EnableItem(h,False)
		.set_ItemData(h,-1)
		h = .AddItem("Item 2")
		.set_ItemData(h,0)
		.AddBar(h,"Task",#1/5/2001#,#1/7/2001#,"B")
		.set_ItemBar(h,"B",exontrol.EXG2ANTTLib.ItemBarPropertyEnum.exBarCanMoveToAnother,True)
		.set_ItemData(.AddItem("Item 3"),0)
		h = .AddItem("Item 4")
		.set_EnableItem(h,False)
		.set_ItemData(h,-1)
	End With
	.EndUpdate()
End With
|
|
1125
|
How can I find out if a date time is a non-working part
' MouseMove event - Occurs when the user moves the mouse.
Private Sub Exg2antt1_MouseMoveEvent(ByVal sender As System.Object, ByVal Button As Short, ByVal Shift As Short, ByVal X As Integer, ByVal Y As Integer) Handles Exg2antt1.MouseMoveEvent
	Dim c,d,h,hit
	With Exg2antt1
		h = .get_ItemFromPoint(-1,-1,c,hit)
		d = .Chart.get_DateFromPoint(-1,-1)
		Debug.Print( d )
		Debug.Print( .Chart.get_IsNonworkingDate(d,h) )
	End With
End Sub

Dim h
With Exg2antt1
	.BeginUpdate()
	.Columns.Add("NonWorking")
	With .Chart
		.FirstWeekDay = exontrol.EXG2ANTTLib.WeekDayEnum.exMonday
		.FirstVisibleDate = #1/24/2008#
		.set_PaneWidth(False,64)
		.LevelCount = 2
	End With
	With .Items
		h = .AddItem("Default")
		h = .AddItem("January")
		.set_ItemNonworkingUnits(h,False,"month(value) = 1")
		h = .AddItem("February, Saturday, Sunday")
		.set_ItemNonworkingUnits(h,False,"month(value) = 2 or (weekday(value) = 0 or weekday(value) = 6)")
		h = .AddItem("Sunday")
		.set_ItemNonworkingUnits(h,False,"weekday(value) = 0")
	End With
	.EndUpdate()
End With
|
|
1124
|
I am using the ItemBar property exBarCanMoveToAnother, How do I stop it from being dropped on certain chart rows
' BarParentChange event - Occurs just before moving a bar from current item to another item.
Private Sub Exg2antt1_BarParentChange(ByVal sender As System.Object, ByVal Item As Integer, ByVal Key As Object, ByVal NewItem As Integer, ByRef Cancel As Boolean) Handles Exg2antt1.BarParentChange
	With Exg2antt1
		Debug.Print( .Items.get_CellCaption(NewItem,0) )
		Cancel = .Items.get_ItemData(NewItem)
	End With
End Sub

Dim h
With Exg2antt1
	.BeginUpdate()
	With .Chart
		.FirstVisibleDate = #1/1/2001#
		.set_PaneWidth(False,48)
		.AllowLinkBars = False
		.Bars.Item("Task").OverlaidType = exontrol.EXG2ANTTLib.OverlaidBarsTypeEnum.exOverlaidBarsTransparent Or exontrol.EXG2ANTTLib.OverlaidBarsTypeEnum.exOverlaidBarsOffset
	End With
	.Columns.Add("Column")
	With .Items
		h = .AddItem("Item 1")
		.set_EnableItem(h,False)
		.set_ItemData(h,-1)
		h = .AddItem("Item 2")
		.set_ItemData(h,0)
		.AddBar(h,"Task",#1/5/2001#,#1/7/2001#,"B")
		.set_ItemBar(h,"B",exontrol.EXG2ANTTLib.ItemBarPropertyEnum.exBarCanMoveToAnother,True)
		.set_ItemData(.AddItem("Item 3"),0)
		.set_ItemData(.AddItem("Item 4"),0)
	End With
	.EndUpdate()
End With
|
|
1123
|
What is the event I should use to capture the click event on the task item on left hand side
' Click event - Occurs when the user presses and then releases the left mouse button over the tree control.
Private Sub Exg2antt1_Click(ByVal sender As System.Object) Handles Exg2antt1.Click
	Dim c,h,hit
	With Exg2antt1
		h = .get_ItemFromPoint(-1,-1,c,hit)
		Debug.Print( .Items.get_CellCaption(h,c) )
	End With
End Sub

Dim h
With Exg2antt1
	.BeginUpdate()
	.LinesAtRoot = exontrol.EXG2ANTTLib.LinesAtRootEnum.exLinesAtRoot
	.Columns.Add("Items")
	With .Items
		h = .AddItem("R1")
		.InsertItem(h,Nothing,"Cell 1.1")
		.InsertItem(h,Nothing,"Cell 1.2")
		.set_ExpandItem(h,True)
		h = .AddItem("R2")
		.InsertItem(h,Nothing,"Cell 2.1")
		.InsertItem(h,Nothing,"Cell 2.2")
		.set_ExpandItem(h,True)
	End With
	.EndUpdate()
End With
|
|
1122
|
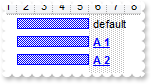
Can I add a hyperlink assigned to a bar
' AnchorClick event - Occurs when an anchor element is clicked.
Private Sub Exg2antt1_AnchorClick(ByVal sender As System.Object, ByVal AnchorID As String, ByVal Options As String) Handles Exg2antt1.AnchorClick
	With Exg2antt1
		Debug.Print( AnchorID )
	End With
End Sub

Dim h
With Exg2antt1
	.BeginUpdate()
	.Columns.Add("Task")
	With .Chart
		.FirstVisibleDate = #1/1/2001#
		.set_PaneWidth(False,48)
	End With
	With .Items
		h = .AddItem("Task 1")
		.AddBar(h,"Task",#1/2/2001#,#1/6/2001#,"K")
		.set_ItemBar(h,"K",exontrol.EXG2ANTTLib.ItemBarPropertyEnum.exBarCaption,"default")
		.set_ItemBar(h,"K",exontrol.EXG2ANTTLib.ItemBarPropertyEnum.exBarHAlignCaption,18)
		h = .AddItem("Task 2")
		.AddBar(h,"Task",#1/2/2001#,#1/6/2001#,"K")
		.set_ItemBar(h,"K",exontrol.EXG2ANTTLib.ItemBarPropertyEnum.exBarCaption,"<a1><b>A 1</b></a>")
		.set_ItemBar(h,"K",exontrol.EXG2ANTTLib.ItemBarPropertyEnum.exBarHAlignCaption,18)
		h = .AddItem("Task 3")
		.AddBar(h,"Task",#1/2/2001#,#1/6/2001#,"K")
		.set_ItemBar(h,"K",exontrol.EXG2ANTTLib.ItemBarPropertyEnum.exBarCaption,"<a2><b>A 2</b></a>")
		.set_ItemBar(h,"K",exontrol.EXG2ANTTLib.ItemBarPropertyEnum.exBarHAlignCaption,18)
	End With
	.EndUpdate()
End With
|
|
1121
|
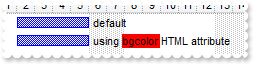
Can I change the background color only for the text (caption) in a bar
Dim h
With Exg2antt1
	.BeginUpdate()
	.Columns.Add("Task")
	With .Chart
		.FirstVisibleDate = #1/1/2001#
		.set_PaneWidth(False,48)
	End With
	With .Items
		h = .AddItem("Task 1")
		.AddBar(h,"Task",#1/2/2001#,#1/6/2001#,"K")
		.set_ItemBar(h,"K",exontrol.EXG2ANTTLib.ItemBarPropertyEnum.exBarCaption,"default")
		.set_ItemBar(h,"K",exontrol.EXG2ANTTLib.ItemBarPropertyEnum.exBarHAlignCaption,18)
		h = .AddItem("Task 2")
		.AddBar(h,"Task",#1/2/2001#,#1/6/2001#,"K")
		.set_ItemBar(h,"K",exontrol.EXG2ANTTLib.ItemBarPropertyEnum.exBarCaption,"using <bgcolor=FF0000>bgcolor</bgcolor> HTML attribute ")
		.set_ItemBar(h,"K",exontrol.EXG2ANTTLib.ItemBarPropertyEnum.exBarHAlignCaption,18)
	End With
	.EndUpdate()
End With
|
|
1120
|
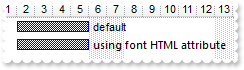
Can I change the font to display the text (caption) in a bar
Dim h
With Exg2antt1
	.BeginUpdate()
	.Columns.Add("Task")
	With .Chart
		.FirstVisibleDate = #1/1/2001#
		.set_PaneWidth(False,48)
	End With
	With .Items
		h = .AddItem("Task 1")
		.AddBar(h,"Task",#1/2/2001#,#1/6/2001#,"K")
		.set_ItemBar(h,"K",exontrol.EXG2ANTTLib.ItemBarPropertyEnum.exBarCaption,"default")
		.set_ItemBar(h,"K",exontrol.EXG2ANTTLib.ItemBarPropertyEnum.exBarHAlignCaption,18)
		h = .AddItem("Task 2")
		.AddBar(h,"Task",#1/2/2001#,#1/6/2001#,"K")
		.set_ItemBar(h,"K",exontrol.EXG2ANTTLib.ItemBarPropertyEnum.exBarCaption,"<font Segoe UI;8 >using font HTML attribute </fgcolor>")
		.set_ItemBar(h,"K",exontrol.EXG2ANTTLib.ItemBarPropertyEnum.exBarHAlignCaption,18)
	End With
	.EndUpdate()
End With
|
|
1119
|
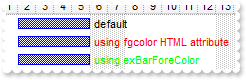
How do i change the forecolor of text (caption) in a bar
Dim h
With Exg2antt1
	.BeginUpdate()
	.Columns.Add("Task")
	With .Chart
		.FirstVisibleDate = #1/1/2001#
		.set_PaneWidth(False,48)
	End With
	With .Items
		h = .AddItem("Task 1")
		.AddBar(h,"Task",#1/2/2001#,#1/6/2001#,"K")
		.set_ItemBar(h,"K",exontrol.EXG2ANTTLib.ItemBarPropertyEnum.exBarCaption,"default")
		.set_ItemBar(h,"K",exontrol.EXG2ANTTLib.ItemBarPropertyEnum.exBarHAlignCaption,18)
		h = .AddItem("Task 2")
		.AddBar(h,"Task",#1/2/2001#,#1/6/2001#,"K")
		.set_ItemBar(h,"K",exontrol.EXG2ANTTLib.ItemBarPropertyEnum.exBarCaption,"<fgcolor=FF0000>using fgcolor HTML attribute </fgcolor>")
		.set_ItemBar(h,"K",exontrol.EXG2ANTTLib.ItemBarPropertyEnum.exBarHAlignCaption,18)
		h = .AddItem("Task 3")
		.AddBar(h,"Task",#1/2/2001#,#1/6/2001#,"K")
		.set_ItemBar(h,"K",exontrol.EXG2ANTTLib.ItemBarPropertyEnum.exBarCaption,"using exBarForeColor")
		.set_ItemBar(h,"K",exontrol.EXG2ANTTLib.ItemBarPropertyEnum.exBarHAlignCaption,18)
		.set_ItemBar(h,"K",exontrol.EXG2ANTTLib.ItemBarPropertyEnum.exBarForeColor,65280)
	End With
	.EndUpdate()
End With
|
|
1118
|
I have noticed that when scrolling horizontally the chart a tooltip shown. is it possible to actually do the scrolling without showing the tooltip
With Exg2antt1
	.BeginUpdate()
	.Columns.Add("Tasks")
	With .Chart
		.FirstVisibleDate = #6/20/2005#
		.AllowLinkBars = True
		.LevelCount = 2
		.set_PaneWidth(False,48)
		.ToolTip = ""
	End With
	With .Items
		.AddBar(.AddItem("Task 1"),"Task",#6/21/2005#,#6/25/2005#,"A")
		.AddBar(.AddItem("Task 2"),"Task",#6/28/2005#,#7/2/2005#,"B")
	End With
	.EndUpdate()
End With
|
|
1117
|
How can I add a bar to be treated as a nonworking part like a "holidays" bar
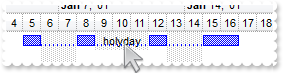
Dim h
With Exg2antt1
	.BeginUpdate()
	With .Chart
		.FirstVisibleDate = #1/1/2001#
		.LevelCount = 2
		.set_PaneWidth(False,48)
		.AllowNonworkingBars = True
		.Bars.Add("Task:Split").Shortcut = "Task"
	End With
	.Columns.Add("Tasks")
	With .Items
		h = .AddItem("Task 1")
		.set_ItemNonworkingUnits(h,False,"weekday(value) in (0,6)")
		.AddBar(h,"",#1/2/2001#,#1/5/2001#,"A","holyday")
		.set_ItemBar(h,"A",exontrol.EXG2ANTTLib.ItemBarPropertyEnum.exBarTreatAsNonworking,True)
		.AddBar(h,"Task",#1/5/2001#,#1/12/2001#,"Z")
		.set_ItemBar(h,"Z",exontrol.EXG2ANTTLib.ItemBarPropertyEnum.exBarKeepWorkingCount,True)
	End With
	.EndUpdate()
End With
|
|
1116
|
Is it possible to add bars that act like a non-working fixed part or the item
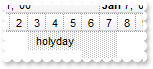
Dim h
With Exg2antt1
	.BeginUpdate()
	With .Chart
		.FirstVisibleDate = #1/1/2001#
		.LevelCount = 2
		.set_PaneWidth(False,48)
		.AllowNonworkingBars = True
	End With
	.Columns.Add("Tasks")
	With .Items
		h = .AddItem("Task 1")
		.set_ItemNonworkingUnits(h,False,"weekday(value) in (0,6)")
		.AddBar(h,"",#1/3/2001#,#1/6/2001#,"h","holyday")
		.set_ItemBar(h,"h",exontrol.EXG2ANTTLib.ItemBarPropertyEnum.exBarTreatAsNonworking,True)
		.set_ItemBar(h,"h",exontrol.EXG2ANTTLib.ItemBarPropertyEnum.exBarSelectable,False)
	End With
	.EndUpdate()
End With
|
|
1115
|
Is it possible to add bars that act like a non-working part or the item
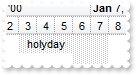
Dim h
With Exg2antt1
	.BeginUpdate()
	With .Chart
		.FirstVisibleDate = #1/1/2001#
		.LevelCount = 2
		.set_PaneWidth(False,48)
		.AllowNonworkingBars = True
	End With
	.Columns.Add("Tasks")
	With .Items
		h = .AddItem("Task 1")
		.set_ItemNonworkingUnits(h,False,"weekday(value) in (0,6)")
		.AddBar(h,"",#1/3/2001#,#1/6/2001#,"h","holyday")
		.set_ItemBar(h,"h",exontrol.EXG2ANTTLib.ItemBarPropertyEnum.exBarTreatAsNonworking,True)
	End With
	.EndUpdate()
End With
|
|
1114
|
How can I change the both dates for the bar at once
Dim h
With Exg2antt1
	.BeginUpdate()
	.Columns.Add("Tasks")
	With .Chart
		.set_PaneWidth(False,64)
		.FirstVisibleDate = #6/21/2005#
		.ShowEmptyBars = 1
	End With
	With .Items
		h = .AddItem("Test")
		.AddBar(h,"Task",#6/22/2005#,#6/26/2005#,"")
		.AddBar(h,"Task",#6/27/2005#,#6/29/2005#)
	End With
	.EndUpdate()
End With
|
|
1113
|
How can I get the selected bars in the chart
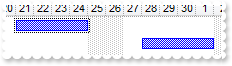
' ChartSelectionChanged event - Occurs when the user selects objects in the chart area.
Private Sub Exg2antt1_ChartSelectionChanged(ByVal sender As System.Object) Handles Exg2antt1.ChartSelectionChanged
	With Exg2antt1
		Debug.Print( .Items.get_SelectedObjects(exontrol.EXG2ANTTLib.SelectObjectsEnum.exSelectBarsOnly) )
	End With
End Sub

With Exg2antt1
	.BeginUpdate()
	.Columns.Add("Tasks")
	With .Chart
		.FirstVisibleDate = #6/20/2005#
		.AllowLinkBars = True
		.LevelCount = 2
		.set_PaneWidth(False,48)
	End With
	With .Items
		.AddBar(.AddItem("Task 1"),"Task",#6/21/2005#,#6/25/2005#,"A")
		.AddBar(.AddItem("Task 2"),"Task",#6/28/2005#,#7/2/2005#,"B")
		.set_ItemBar(.FirstVisibleItem,.get_FirstItemBar(.FirstVisibleItem),exontrol.EXG2ANTTLib.ItemBarPropertyEnum.exBarSelected,True)
	End With
	.EndUpdate()
End With
|
|
1112
|
How can I list the actions that can be performed by undo operations
' ChartEndChanging event - Occurs after the chart has been changed.
Private Sub Exg2antt1_ChartEndChanging(ByVal sender As System.Object, ByVal Operation As exontrol.EXG2ANTTLib.BarOperationEnum) Handles Exg2antt1.ChartEndChanging
	With Exg2antt1
		Debug.Print( .Chart.get_UndoListAction() )
	End With
End Sub

Dim h
With Exg2antt1
	.BeginUpdate()
	.Chart.FirstVisibleDate = #1/1/2001#
	.Chart.AllowLinkBars = False
	.Chart.Bars.Item("Task").OverlaidType = exontrol.EXG2ANTTLib.OverlaidBarsTypeEnum.exOverlaidBarsTransparent Or exontrol.EXG2ANTTLib.OverlaidBarsTypeEnum.exOverlaidBarsOffset
	.Chart.AllowUndoRedo = True
	.Chart.set_PaneWidth(False,32)
	.Chart.Bars.Add("Task:Split").Shortcut = "Task"
	.Columns.Add("Column")
	With .Items
		.AddBar(.AddItem("Item 1"),"Task",#1/2/2001#,#1/4/2001#,"A")
		h = .AddItem("Item 2")
		.AddBar(h,"Task",#1/5/2001#,#1/9/2001#,"B")
		.set_ItemBar(h,"B",exontrol.EXG2ANTTLib.ItemBarPropertyEnum.exBarCanMoveToAnother,True)
		.set_ItemBar(h,"B",exontrol.EXG2ANTTLib.ItemBarPropertyEnum.exBarKeepWorkingCount,True)
		.set_ItemNonworkingUnits(.AddItem("Item 3"),False,"weekday(value)=0")
		.set_ItemNonworkingUnits(.AddItem("Item 4"),False,"weekday(value) in (3,5)")
	End With
	.EndUpdate()
End With
|
|
1111
|
How can I change the predefined labels being displayed in the chart's header so it shows the data in short format with no literals
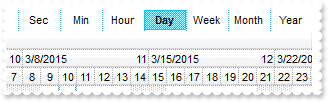
With Exg2antt1
	.BeginUpdate()
	With .Chart
		.set_PaneWidth(False,0)
		.AllowOverviewZoom = exontrol.EXG2ANTTLib.OverviewZoomEnum.exAlwaysZoom
		.OverviewVisible = exontrol.EXG2ANTTLib.OverviewVisibleEnum.exOverviewShowAllVisible
		.LevelCount = 3
		.set_Label(exontrol.EXG2ANTTLib.UnitEnum.exYear,"<%yy%><|><%yyyy%>")
		.set_Label(exontrol.EXG2ANTTLib.UnitEnum.exHalfYear,"")
		.set_Label(exontrol.EXG2ANTTLib.UnitEnum.exQuarterYear,"")
		.set_Label(exontrol.EXG2ANTTLib.UnitEnum.exMonth,"<|><%m%><|><%m%>/<%yy%><|><%m%>/<%yyyy%>")
		.set_Label(exontrol.EXG2ANTTLib.UnitEnum.exThirdMonth,"")
		.set_Label(exontrol.EXG2ANTTLib.UnitEnum.exWeek,"<|><%ww%><|><%m%>/<%d%>/<%yy%><r><%ww%><|><%m%>/<%d%>/<%yyyy%><r><%ww%><||><||>256")
		.set_Label(exontrol.EXG2ANTTLib.UnitEnum.exDay,"<|><%d%><|><%m%>/<%d%>/<%yy%><|><%m%>/<%d%>/<%yyyy%><||><||>4096")
		.set_Label(exontrol.EXG2ANTTLib.UnitEnum.exHour,"<|><%hh%><|><%m%>/<%d%>/<%yy%> <%h%> <%AM/PM%><|><%m%>/<%d%>/<%yyyy%> <%h%> <%AM/PM%><||><||>65536")
		.set_Label(exontrol.EXG2ANTTLib.UnitEnum.exMinute,"<|><%nn%><|><%h%>:<%nn% <%AM/PM%>><|><%m%>/<%d%>/<%yy%> <%h%>:<%nn%> <%AM/PM%><|><%m%>/<%d%>/<%yyyy%> <%h%>:<%nn%> <%AM/PM%>")
		.set_Label(exontrol.EXG2ANTTLib.UnitEnum.exSecond,"<|><%ss%><|><%nn%>:<%ss%><|><%h%>:<%nn%>:<%ss%> <%AM/PM%><|><%m%>/<%d%>/<%yy%> <%h%>:<%nn%>:<%ss%> <%AM/PM%><|><%m%>/<%d%>/<%yy" & _
	"yy%> <%h%>:<%nn%>:<%ss%> <%AM/PM%>")
		.set_LabelToolTip(exontrol.EXG2ANTTLib.UnitEnum.exYear,"<%yyyy%>")
		.set_LabelToolTip(exontrol.EXG2ANTTLib.UnitEnum.exHalfYear,"")
		.set_LabelToolTip(exontrol.EXG2ANTTLib.UnitEnum.exQuarterYear,"")
		.set_LabelToolTip(exontrol.EXG2ANTTLib.UnitEnum.exMonth,"<%m%>/<%yyyy%>")
		.set_LabelToolTip(exontrol.EXG2ANTTLib.UnitEnum.exThirdMonth,"")
		.set_LabelToolTip(exontrol.EXG2ANTTLib.UnitEnum.exWeek,"<%m%>/<%d%>/<%yyyy%> <%ww%>")
		.set_LabelToolTip(exontrol.EXG2ANTTLib.UnitEnum.exDay,"<%m%>/<%d%>/<%yyyy%>")
		.set_LabelToolTip(exontrol.EXG2ANTTLib.UnitEnum.exHour,"<%m%>/<%d%>/<%yyyy%> <%h%> <%AM/PM%>")
		.set_LabelToolTip(exontrol.EXG2ANTTLib.UnitEnum.exMinute,"<%m%>/<%d%>/<%yyyy%> <%h%>:<%nn%> <%AM/PM%>")
		.set_LabelToolTip(exontrol.EXG2ANTTLib.UnitEnum.exSecond,"<%m%>/<%d%>/<%yyyy%> <%h%>:<%nn%>:<%ss%> <%AM/PM%>")
		.UnitScale = exontrol.EXG2ANTTLib.UnitEnum.exDay
	End With
	.EndUpdate()
End With
|
|
1110
|
The histogram does not show (correctly) the bars, even if I changed the Bar.HistogramPattern and Bar.HistogramColor properties. What can be wrong
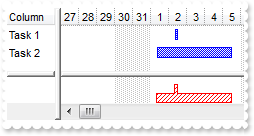
With Exg2antt1
	.BeginUpdate()
	With .Chart
		.set_PaneWidth(False,48)
		.FirstVisibleDate = #12/27/2000#
		.HistogramVisible = True
		.HistogramHeight = 32
		With .Bars.Item("Task")
			.HistogramPattern = exontrol.EXG2ANTTLib.PatternEnum.exPatternBDiagonal
			.HistogramColor = Color.FromArgb(255,0,0)
		End With
		.ResizeUnitScale = exontrol.EXG2ANTTLib.UnitEnum.exHour
	End With
	.Columns.Add("Column")
	With .Items
		.AddBar(.AddItem("Task 1"),"Task",#1/2/2001 8:00:00 AM#,#1/2/2001 0:00:00 PM#)
		.AddBar(.AddItem("Task 2"),"Task",#1/1/2001 8:00:00 AM#,#1/5/2001 0:00:00 PM#)
	End With
	.EndUpdate()
End With
|
|
1109
|
How can I change the default key for the newly added link from "Link1" to my identifier
' AddLink event - Occurs when the user links two bars using the mouse.
Private Sub Exg2antt1_AddLink(ByVal sender As System.Object, ByVal LinkKey As String) Handles Exg2antt1.AddLink
	With Exg2antt1
		With .Items
			.AddLink("newIDlink",.get_Link(LinkKey,exontrol.EXG2ANTTLib.LinkPropertyEnum.exLinkStartItem),.get_Link(LinkKey,exontrol.EXG2ANTTLib.LinkPropertyEnum.exLinkStartBar),.get_Link(LinkKey,exontrol.EXG2ANTTLib.LinkPropertyEnum.exLinkEndItem),.get_Link(LinkKey,exontrol.EXG2ANTTLib.LinkPropertyEnum.exLinkEndBar))
			.RemoveLink(LinkKey)
		End With
	End With
End Sub

' MouseMove event - Occurs when the user moves the mouse.
Private Sub Exg2antt1_MouseMoveEvent(ByVal sender As System.Object, ByVal Button As Short, ByVal Shift As Short, ByVal X As Integer, ByVal Y As Integer) Handles Exg2antt1.MouseMoveEvent
	With Exg2antt1
		Debug.Print( .Chart.get_LinkFromPoint(-1,-1) )
	End With
End Sub

With Exg2antt1
	.BeginUpdate()
	.Columns.Add("Tasks")
	With .Chart
		.FirstVisibleDate = #6/20/2005#
		.AllowLinkBars = True
		.LevelCount = 2
		.set_PaneWidth(False,48)
	End With
	With .Items
		.AddBar(.AddItem("Task 1"),"Task",#6/21/2005#,#6/25/2005#,"")
		.AddBar(.AddItem("Task 2"),"Task",#6/28/2005#,#7/2/2005#,"")
	End With
	.EndUpdate()
End With
|
|
1108
|
How can I change the default key for the newly added link from "Link1" to my identifier
' AllowLink event - Notifies at runtime when a link between two bars is possible.
Private Sub Exg2antt1_AllowLink(ByVal sender As System.Object, ByVal StartItem As Integer, ByVal StartBarKey As Object, ByVal EndItem As Integer, ByVal EndBarKey As Object, ByRef LinkKey As Object, ByRef Cancel As Boolean) Handles Exg2antt1.AllowLink
	With Exg2antt1
		LinkKey = "newIDlink"
	End With
End Sub

' MouseMove event - Occurs when the user moves the mouse.
Private Sub Exg2antt1_MouseMoveEvent(ByVal sender As System.Object, ByVal Button As Short, ByVal Shift As Short, ByVal X As Integer, ByVal Y As Integer) Handles Exg2antt1.MouseMoveEvent
	With Exg2antt1
		Debug.Print( .Chart.get_LinkFromPoint(-1,-1) )
	End With
End Sub

With Exg2antt1
	.BeginUpdate()
	.Columns.Add("Tasks")
	With .Chart
		.FirstVisibleDate = #6/20/2005#
		.AllowLinkBars = True
		.LevelCount = 2
		.set_PaneWidth(False,48)
	End With
	With .Items
		.AddBar(.AddItem("Task 1"),"Task",#6/21/2005#,#6/25/2005#,"")
		.AddBar(.AddItem("Task 2"),"Task",#6/28/2005#,#7/2/2005#,"")
	End With
	.EndUpdate()
End With
|
|
1107
|
We want to have a Task ID column as the first column that shows the row number. How can we do that
' FormatColumn event - Fired when a cell requires to format its caption.
Private Sub Exg2antt1_FormatColumn(ByVal sender As System.Object, ByVal Item As Integer, ByVal ColIndex As Integer, ByRef Value As Object) Handles Exg2antt1.FormatColumn
	With Exg2antt1
		Value = .Items.get_ItemPosition(Item)
	End With
End Sub

With Exg2antt1
	.BeginUpdate()
	.Columns.Add("Task")
	With .Columns.Add("Pos")
		.Width = 24
		.AllowSizing = False
		.Position = 0
		.FireFormatColumn = True
	End With
	With .Items
		.AddItem("Task A")
		.AddItem("Task B")
		.AddItem("Task C")
		.AddItem("Task D")
	End With
	.EndUpdate()
End With
|
|
1106
|
How can I get the caption of focused item
' SelectionChanged event - Fired after a new item has been selected.
Private Sub Exg2antt1_SelectionChanged(ByVal sender As System.Object) Handles Exg2antt1.SelectionChanged
	With Exg2antt1
		With .Items
			Debug.Print( "Handle" )
			Debug.Print( .FocusItem )
			Debug.Print( "Caption" )
			Debug.Print( .get_CellCaption(.FocusItem,0) )
		End With
	End With
End Sub

Dim h
With Exg2antt1
	.BeginUpdate()
	.LinesAtRoot = exontrol.EXG2ANTTLib.LinesAtRootEnum.exLinesAtRoot
	.Columns.Add("Items")
	With .Items
		h = .AddItem("R1")
		.InsertItem(h,Nothing,"Cell 1.1")
		.InsertItem(h,Nothing,"Cell 1.2")
		.set_ExpandItem(h,True)
		h = .AddItem("R2")
		.InsertItem(h,Nothing,"Cell 2.1")
		.InsertItem(h,Nothing,"Cell 2.2")
		.set_ExpandItem(h,True)
	End With
	.EndUpdate()
End With
|
|
1105
|
How can I get the caption of selected item
' SelectionChanged event - Fired after a new item has been selected.
Private Sub Exg2antt1_SelectionChanged(ByVal sender As System.Object) Handles Exg2antt1.SelectionChanged
	With Exg2antt1
		With .Items
			Debug.Print( "Handle" )
			Debug.Print( .get_SelectedItem(0) )
			Debug.Print( "Caption" )
			Debug.Print( .get_CellCaption(.get_SelectedItem(0),0) )
		End With
	End With
End Sub

Dim h
With Exg2antt1
	.BeginUpdate()
	.LinesAtRoot = exontrol.EXG2ANTTLib.LinesAtRootEnum.exLinesAtRoot
	.Columns.Add("Items")
	With .Items
		h = .AddItem("R1")
		.InsertItem(h,Nothing,"Cell 1.1")
		.InsertItem(h,Nothing,"Cell 1.2")
		.set_ExpandItem(h,True)
		h = .AddItem("R2")
		.InsertItem(h,Nothing,"Cell 2.1")
		.InsertItem(h,Nothing,"Cell 2.2")
		.set_ExpandItem(h,True)
	End With
	.EndUpdate()
End With
|
|
1104
|
How can I get the link from the point
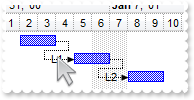
' MouseMove event - Occurs when the user moves the mouse.
Private Sub Exg2antt1_MouseMoveEvent(ByVal sender As System.Object, ByVal Button As Short, ByVal Shift As Short, ByVal X As Integer, ByVal Y As Integer) Handles Exg2antt1.MouseMoveEvent
	With Exg2antt1
		Debug.Print( .Chart.get_LinkFromPoint(-1,-1) )
	End With
End Sub

Dim h1,h2,h3
With Exg2antt1
	.BeginUpdate()
	.Columns.Add("Task")
	With .Chart
		.FirstVisibleDate = #12/29/2000#
		.set_PaneWidth(False,64)
		.LevelCount = 2
	End With
	With .Items
		h1 = .AddItem("Task 1")
		.AddBar(h1,"Task",#1/2/2001#,#1/4/2001#,"K1")
		h2 = .AddItem("Task 2")
		.AddBar(h2,"Task",#1/5/2001#,#1/7/2001#,"K2")
		.AddLink("L1",h1,"K1",h2,"K2")
		.set_Link("L1",exontrol.EXG2ANTTLib.LinkPropertyEnum.exLinkText,"L1")
		h3 = .AddItem("Task 3")
		.AddBar(h3,"Task",#1/8/2001#,#1/10/2001#,"K3")
		.AddLink("L2",h2,"K2",h3,"K3")
		.set_Link("L2",exontrol.EXG2ANTTLib.LinkPropertyEnum.exLinkText,"L2")
	End With
	.EndUpdate()
End With
|
|
1103
|
How can I get the bar from the point
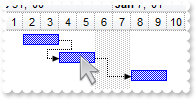
' MouseMove event - Occurs when the user moves the mouse.
Private Sub Exg2antt1_MouseMoveEvent(ByVal sender As System.Object, ByVal Button As Short, ByVal Shift As Short, ByVal X As Integer, ByVal Y As Integer) Handles Exg2antt1.MouseMoveEvent
	With Exg2antt1
		Debug.Print( .Chart.get_BarFromPoint(-1,-1) )
	End With
End Sub

Dim h1,h2,h3
With Exg2antt1
	.BeginUpdate()
	.Columns.Add("Task")
	With .Chart
		.FirstVisibleDate = #12/29/2000#
		.set_PaneWidth(False,64)
		.LevelCount = 2
	End With
	With .Items
		h1 = .AddItem("Task 1")
		.AddBar(h1,"Task",#1/2/2001#,#1/4/2001#,"K1")
		h2 = .AddItem("Task 2")
		.AddBar(h2,"Task",#1/4/2001#,#1/6/2001#,"K2")
		.AddLink("L1",h1,"K1",h2,"K2")
		h3 = .AddItem("Task 3")
		.AddBar(h3,"Task",#1/8/2001#,#1/10/2001#,"K3")
		.AddLink("L2",h2,"K2",h3,"K3")
	End With
	.EndUpdate()
End With
|
|
1102
|
How can I get the level from the cursor
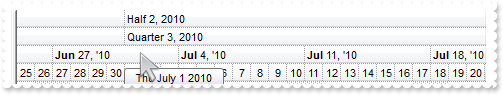
' MouseMove event - Occurs when the user moves the mouse.
Private Sub Exg2antt1_MouseMoveEvent(ByVal sender As System.Object, ByVal Button As Short, ByVal Shift As Short, ByVal X As Integer, ByVal Y As Integer) Handles Exg2antt1.MouseMoveEvent
	With Exg2antt1
		Debug.Print( .Chart.get_LevelFromPoint(-1,-1) )
	End With
End Sub

With Exg2antt1
	With .Chart
		.FirstVisibleDate = #6/25/2010#
		.set_PaneWidth(False,0)
		.LevelCount = 4
	End With
End With
|
|
1101
|
How can I get the date from the cursor
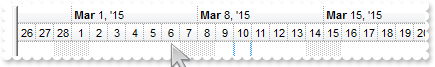
' MouseMove event - Occurs when the user moves the mouse.
Private Sub Exg2antt1_MouseMoveEvent(ByVal sender As System.Object, ByVal Button As Short, ByVal Shift As Short, ByVal X As Integer, ByVal Y As Integer) Handles Exg2antt1.MouseMoveEvent
	With Exg2antt1
		Debug.Print( .Chart.get_DateFromPoint(-1,-1) )
	End With
End Sub

With Exg2antt1
	With .Chart
		.set_PaneWidth(False,0)
		.LevelCount = 2
	End With
End With
|